
More Information
Submitted: 19 July 2019 | Approved: 31 July 2019 | Published: 01 August 2019
How to cite this article: Lu D, Peng X, Jia S, Li G, Tan N, et al. Carbonic Anhydrase I modifies SOD1-induced motor neuron toxicity in Drosophila via ER stress pathway. J Neurosci Neurol Disord. 2019; 3: 135-144.
DOI: 10.29328/journal.jnnd.1001024
Copyright License: © 2019 Lu D, et al. This is an open access article distributed under the Creative Commons Attribution License, which permits unrestricted use, distribution, and reproduction in any medium, provided the original work is properly cited.
Keywords: Carbonic Anhydrase 1 (CA1); SOD1; ALS; Drosophila; Motor neuron; Endoplasmic Reticulum (ER) stress

Carbonic Anhydrase I modifies SOD1-induced motor neuron toxicity in Drosophila via ER stress pathway
Deyi Lu, Xiao Peng, Xuejiao Jia, Guiyi Li, Na Tan, Zhen Wei, Xinzhu Fei, Xiaochen Liu, Tatsuhiko Kadowaki and Jian Liu*
Department of Biological Sciences, Xi’an Jiaotong, Liverpool University, Suzhou, Jiangsu Province, PR China
*Address for Correspondence: Jian Liu, Department of Biological Sciences, Xi’an Jiaotong, Liverpool University, Suzhou, Jiangsu Province, PR China, Tel: +86 512 8816 1655, +86 15150419088; 1-602-596-2498; Email: [email protected]; [email protected]
Background: Drosophila models of amyotrophic lateral sclerosis (ALS) have been widely used in understanding molecular mechanisms of ALS pathogenesis as well as discovering potential targets for therapeutic drugs. Mutations in the copper/zinc superoxide dismutase (SOD1) cause ALS by gain of toxic functions and induce toxicity in fly motor neurons.
Results: In this study, we have determined that human carbonic anhydrase I (CA1) can alleviate mutant SOD1-induced motor neuron toxicity in the transgenic fly model of ALS. Interestingly, we found that motor neuron expression of CA1 could independently induce locomotion defect as well as decreasing the survival rate. In addition, CA1-induced toxicity in motor neurons is anhydrase activity-dependent. Mechanistically, we identified that both SOD1- and CA1-induced toxicity involve the activation of eIF2α in the ER stress response pathway. Downstream activation of the JNK pathway has also been implicated in the induced toxicity.
Conclusion: Our results have confirmed that SOD1-induced toxicity in fly motor neuron also involves endoplasmic reticulum (ER) stress pathway. More importantly, we have discovered a new cellular role that CA1 plays by antagonizing mutant SOD1-induced toxicity in motor neurons involving the ER stress pathway. Such information can be potentially useful for further understanding disease mechanisms and developing therapeutic targets for ALS.
AAZ: Acetazolamide; ALS: Amyotrophic Lateral Sclerosis; FALS: Familial Amyotrophic Lateral Sclerosis; SALS: Sporadic Amyotrophic Lateral Sclerosis; ASK1: Apoptosis Signal Regulating Kinase 1; ATF4: Activating Transcription Factor 4; BSA: Bovine Serum Albumin; CA: Carbonic Anhydrase; CA1: Carbonic Anhydrase I; CAH1: Drosophila Carbonic Anhydrase form 1; CAH2: Drosophila Carbonic Anhydrase form 2; hCA1: Human Carbonic Anhydrase 1; CMT1A: Charcot-Marie-Tooth type 1A; DDS: Direct Digital Synthesis; Derlin-1: Degradation in Endoplasmic Reticulum Protein 1; dDerlin-1: Drosophila degradation in Endoplasmic Reticulum Protein 1; hDerlin-1: human Degradation in Endoplasmic Reticulum Protein 1; DMSO: Dimethyl Sulfoxide; dsod: Drosophila copper/zinc superoxide dismutase gene; E106I: Human CA1 mutant with a mutation in the amino acid at position 106 from glutamic acid (E) to isoleucine (I); eIF2α: eukaryotic translation Initiation Factor 2 subunit alpha; p-eIF2α: phosphorylated eukaryotic translation Initiation Factor 2 subunit alpha; ER: Endoplasmic Reticulum; FUS: Fused in Sarcoma, an RNA-binding protein; G93A: Human copper/zinc superoxide dismutase mutant with a mutation in the amino acid at the position 93 from glycine (G) to alanine (A); GFP: Green Fluorescent Protein; HNPP: Hereditary Neuropathy with liability to Pressure Palsies; Hsp70: The 70 kDa heat shock protein; JNK: c-Jun N-terminal Kinases; p-JNK: phosphorylated c-Jun N-terminal Kinases; PFN1: Profilin 1; PMP22: Peripheral Myelin Protein-22; SOD1: Copper/Zinc superoxide Dismutase; SOD1G85R: Human copper/zinc superoxide dismutase mutant with a mutation in the amino acid at the position 85 from glycine (G) to arginine (R); dSOD1: Drosophila Copper/Zinc Superoxide Dismutase; hSOD1: human Copper/Zinc Superoxide Dismutase; TBST: Tris-Buffered Saline, pH 7.5, 0.05% Tween 20; TDP-43: TAR DNA-Binding Protein; TRAF2: TNF Receptor-Associated Factor 2; XBP1: X-box Binding Protein 1; CA1 flies: Transgenic flies expressing human CA1 in motor neurons; E106I flies: Transgenic flies expressing human CA1 mutant E106I in motor neurons; GFP flies: Transgenic flies expressing GFP in motor neurons; SOD1 flies: transgenic flies expressing SOD1G85R mutant in motor neurons; CA1+SOD1 flies: transgenic flies expressing human CA1 and SOD1G85R mutant in motor neurons
Amyotrophic lateral sclerosis (ALS) is an adult-onset motor neuron disease characterized by the predominant loss of motor neurons in the spinal cord, brain stem, and motor cortex [1]. More than 90% of ALS is sporadic (SALS) while about 10% is inherited. According to the most recent review article, a total of 27 genes with diverse functions have been listed to be linked to familial ALS (FALS) [2]. The mechanisms of ALS pathogenesis are complex involving many players and pathways [3]. Recently, it was reported that human carbonic anhydrase I (hCA1) might be a player in ALS pathology as its levels were increased in spinal cord motor neurons of ALS patients including SALS and FALS [4]. Carbonic anhydrases (CAs) catalyze the reversible conversion from carbon dioxide and water to bicarbonate and proton which is the most essential and fundamental process in cellular metabolisms [5]. CAs are responsible for dynamically regulating and maintaining the intracellular and extracellular pH [6]. CA1 is known to be one of the cytosolic isoforms of 17 mammalian CAs which are present in several subcellular compartments [5]. In addition to its expression in erythrocytes, several types of epithelial cells, synovium, and cardiac capillary endothelial cells, CA1 expression was also detected in the motor neurons of human spinal cord [4]. In Drosophila, there are two forms of CAs, CAH1 and CAH2 [7]. Phylogenetic analysis indicates that CAH1 and mammalian cytosolic forms of CAs share a common ancestor while CAH2 shares a common ancestor with the extracellular form of CAs [7]. Drosophila CAH1 (dCAH1) shares 44.6% identity with hCA1 in the overall amino acid sequences (Figure S1). Fly CAH1 expression can be detected in the salivary gland, hindgut and midgut, eye as well as the brain [7]. Knockdown of fly CAH1 in the midgut resulted in a less acid environment [8]. More importantly, changes in CA1 levels have been detected in several pathological conditions including the inflammation, cancer and brain injury [9-18]. However, the roles CA1 might play in motor neurons in the contexts of both physiology and pathology are completely unknown.
The copper/zinc superoxide dismutase (SOD1) was the first gene discovered in 1993 that is responsible for 20% of FALS [19]. Tremendous amount of information has been obtained in rodent models of SOD1-linked ALS as well as from in vitro mammalian cells. It has been established that mutant SOD1s cause ALS in a dominant fashion by gain of toxic function rather than loss of enzyme activity [20,21]. One piece of the overwhelming data to support this gain of toxicity was the fact that more than 130 mutant SOD1s selectively interact with human Derlin-1 (hDerlin-1) while the wild-type SOD1 does not [22]. Furthermore, the mechanism of the gained toxicity by the SOD1 mutants is the activation of endoplasmic reticulum (ER) stress response resulting in trapping apoptosis signal-regulating kinase 1 (ASK1) in the aggregates followed by downstream activation of the c-Jun N-terminal kinases (JNK) pathway [23]. The Drosophila model of SOD1-linked toxicity in motor neurons was also established [24]. Even though the SOD1 gene is highly conserved among many species, Drosophila SOD1 protein (dSOD1) shares 61% identity with human SOD1 (hSOD1) [24]. In addition, overexpression of wild-type or ALS-linked mutant hSOD1s in fly motor neurons was toxic, while overexpression of the Drosophila SOD1 gene (dsod) was not [24]. Stress response of Hsp70 activation in glia was reported to be associated with the toxicity [24]. Similar to what’s discovered in mouse [20], dsodnull flies had defect but did not readily exhibit ALS-like phenotype [25]. Interestingly, the Drosophila knock-in model of hSOD1 mutations was reported [25]. Flies homozygous for the knock-in dsod which contained the equivalent human ALS mutation were lethal, while flies heterozygous for the same knock-in mutant gene exhibited ALS-like pathology in a recessive manner [25]. Because mutant SOD1s act in a dominant fashion in humans, we decided to use the fly model of ALS which overexpresses the mutant form of ALS (SOD1G85R) as originally described by Watson et al. [24] for our study. In order to understand the role of CA1 in ALS pathology, we decided to examine whether SOD1-induced toxicity in fly motor neurons can be modified by the presence of hCA1. We also make the following hypotheses: 1) the molecular mechanism of SOD1-induced damage in fly motor neurons might be through Derlin-1, ASK1 and JNK pathways; 2) if CA1 can modify the process, it can also imply for the first time a new role CA1 might play in motor neurons.
Plasmid constructs
The cDNA for human CA1 was purchased from Genscript (Clone ID: OHu24513, Piscataway, NJ, USA). The E106I mutant form of CA1 was generated via site-directed mutagenesis via two rounds of PCR as described by Mohanty et al. [26]. Briefly, a total of 4 primers were designed and used in the PCRs. The sequences of the primers are: F1:
5’-TACTGGCTTATCGAAATTAATACGACTCACTATAGGG-3’; R1: 5’-
TGGCAACTAGAAGGCACAGTCGAGG-3’; F2:
5’-GAGCATGGTTCAatcCATACAGTGGATGG-3’; and R2:
5’-ATCCACTGTATGgatTGAACCATGCTCATT-3’.
The nucleotide sequences in lower cases in Primers F2 and R2 indicate the mutated nucleotides that will result in the altered amino acid from glutamic acid (E) to isoleucine (I) at the amino acid poistion 106 in the CA1 peptide. The final PCR fragment was purified and cloned into pcDNA3.1 (+) and the mutations were confirmed by sequencing. The cDNA of CA1 or E106I was cloned into the Xba I and Kpn I site of the pUASTattB plasmid for making transgenic flies.
Fly strains and crosses
Flies were maintained and aged with the standard medium (8% Brewer’s yeast/2% yeast extract/2% peptone/3% sucrose/6% glucose/0.05% MgSO4/0.05% CaCl2/0.6% propionic acid/1% methyl 4-hydroxybenzoate with 1% agar) at 25°C with the 12-hour light-dark cycle. Transgenic lines carrying UAS-GFP.S65T (RRID: BDSC_57064), UAS-SOD1G85R (RRID: BDSC_33608), D42-GAL4 (RRID: BDSC_8816) were obtained from the Bloomington Drosophila Stock Center (BDSC, Bloomington, IN, USA). Transgenic flies carrying UAS-CA1 (the wild-type CA1) and UAS-E106I (the mutant form of CA1) were made by Best Gene Inc (Chino Hills, CA, USA). Purified pUASTattB plasmids containing the cDNAs for CA1 or E106I mutant were used for the PhiC31 Standard plan to make transgenic flies (www.thebestgene.com). The injection stock 8622 (http://flybase.org/reports/FBst0008622.html) which has the attP2 site on chromosome 3L was used for both UAS-CA1 and UAS-E106I transgenes. D42>GFP.S65T, D42>CA1, D42>CA1E106I, and D42>SOD1G85R flies were generated by crossing D42-GAL4 with UAS-GFP.S65T, UAS-CA1, UAS- CA1E106I and UAS-SOD1G85R flies to produce F1 progeny which will be described as GFP, CA1, E106I, SOD1 flies throughout this paper. The transgenic line homozygous of the transgenes UAS-CA1 and D42-GAL4 on the 3rd chromosome was generated by the recombination. Transgenic flies that express both CA1 and SOD1 (which will be described as CA1+SOD1 flies throughout this paper) were made by crossing D42-GAL4:CA1 with UAS-SOD1G85R.
The crawling test
Third instar larvae were used for the crawling test conducted at 25°C. A dissecting microscope equipped with a camera, DDS function generator and computer were used to image the larval locomotion movements on the surface of 1% agarose gel in a 10-cm dish against a black background together with a reference ruler. One larva was taken out from the vial and put on the agarose gel to allow it to acclimate to the environment for 2 min after which time its movement was captured by the camera using a customized macro command in ImagePro software. The video images were collected by taking a snap picture every 0.5 second for a total period of 100 seconds. The larva’s position on the plate was manually tracked and the total crawling distance of its movements was calibrated using the reference calibration curve.
The climbing assay
Male flies of F1 progeny from the correct genotypes including GFP, CA1, SOD1 and CA1+SOD1 flies were collected within 24 hrs after eclosion and designated as Day 1 flies. A total of 10 male flies were collected in one vial. The climbing assay was conducted according to the method described by Romero et al. [27]. Briefly, on Day 2, the flies in each vial were transferred to a clean vial on which a 5 cm line was marked from the bottom. After being acclimated in the testing vial for 5 min, the flies were tapped down to the bottom of the vial and the number of flies which climbed above the 5 cm line at least once within 18 seconds were recorded. This performance was repeated twice for each vial. The climbing index is calculated as the average of the three recorded numbers divided by the total number of flies in each vial. When no flies were alive in a vial, the climbing index for that vial no longer exists for that time point and all the time points afterwards. All flies were tested every three days, from Day 2 to Day 38, the data from all vials from different independent experiments were combined and analyzed. After the test, the flies were placed in a new vial with fresh growth medium.
Measurement of the rate of survival
The rate of survival was also measured for the flies used in the climbing test every three days and the total number of alive flies on the test day were recorded. The rate of survival was calculated by the recorded fly number on the testing day divided by the total number of flies on Day 1 for each vial. Once no flies were alive in a vial, the survival rate for that vial reached zero and remained zero for all the time points afterwards. Data from all vials in different independent experiments were combined and used for making the survival curves.
Western blot analysis
Determination of transgene expression in flies was conducted by extracting proteins from an individual fly using the 1X sample loading buffer (50 mM Tris-HCl pH 6.8/2% SDS/10% glycerol/1% β-mercaptoethanol/0.02 % bromophenol blue). A total of 3 randomly collected flies were test for each cross. Examination of changes in the levels for proteins involved in pathology was performed using the dissected head and trunk materials from the fly. The tissues were homogenized in the lysis buffer containing 20 mM Tris-HCl (pH 7.5)/12 mM β-glycerophosphate/150 mM NaCl/5 mM EGTA/10 mM NaF/1% Triton X-100/1% deoxycholate/1 mM DTT/1 mM sodium orthovanadate, and 1X proteinase inhibitor cocktail (ThermoFisher Scientific, Waltham, MA, USA). An equal number of flies was used for each time point. Protein samples are separated on the SDS/PAGE gel, transferred onto the nitrocellulose membrane and probed with the desired antibodies. The membrane was blocked in either milk or BSA in TBST, incubated with the primary antibody, washed, incubated with the secondary antibody and washed again. The images were acquired on Odyssey and the data were analyzed using Image Studio Lite Ver 5.2 software.
Co-immunoprecipitation
The head and thorax of the fly was dissected out and used for co-immunoprecipitation (co-IP). Proteins were extracted in the same lysis buffer as used for Western Blot analysis by homogenizing the tissues and taking the supernatant after microcentrifugation at the maximal speed for 30 min at 4oC. Protein concentrations were determined using the BCA method (ThermoFisher Scientific, Waltham, MA, USA). Co-IP was performed in the IP buffer (20 mM Tris/150 mM NaCl/1% Triton, pH 7.5) with a ratio of 5µg: 1 mg for antibody and protein, respectively. The IP volume is 350 µl and proteins were pre-cleaned with Protein G beads (GE Healthcare, Pittsburgh, PA, USA) for 2hr at 4oC, followed by incubation with the IP antibody overnight at 4oC. The beads were washed with IP buffer three times followed by one last wash in 1X PBS. Both a fraction of the supernatant and all proteins on the beads were subjected to Western Blot analysis.
Antibodies
The GFP antibody was from ProSci (XR-9001, Poway, CA, USA). The SOD1 antibody used in Western Blot analysis was from Enzo Life Sciences (ADI-SOD1-100, Farmingdale, NY, USA), the one used in co-IP was from Leica Biosystems (NCL-SOD1, Newcastle, UK). The actin antibody was from Sigma (A2066, St Louis, MO, USA). The antibodies against CA1 (ab124976, used in Western Blot; ab54912, used in co-IP), tubulin (ab52866) were from Abcam (Burlingame, CA, USA). The antibodies that detect only the phosphorylated eIF2α (CST#9721) and JNK (CST#9251) were from Cell Signaling Technology (Davers, MA, USA). The antibody specific for detecting Drosophila Derlin-1 but not human Derlin-1 was generated by making a polyclonal antibody against the epitope sequence of RAPPRQATESPWG produced by GenScript (Nanjing, China). The specificity of the antibody was confirmed by epitope peptide competition experiment using proteins from fly and human samples.
Statistical analysis
Statistical analysis was performed using either the Student T-test or GraphPad Prism 8 software.
CA1 causes motor neuron toxicity at the larval stage and in adults
In order to understand whether CA1 can modulate mutant SOD1-induced toxicity, we first examined locomotion function in transgenic flies that express hCA1 in the motor neurons by the binary expression system of the D42-GAL4 [28] and UAS-hCA1 (see also Materials and Methods). These flies will be described as CA1 flies for this study. The locomotion function was measured by the crawling distance and climbing index at the larval stage as well as in adults, respectively. In addition, the rate of survival was also determined. Western Blot analysis of proteins from the individual fly demonstrated that the respective transgene expression of GFP and CA1 in fly motor neurons was readily detectable by the antibodies (Figure 1a, GFP & CA1). Using the 3rd instar larvae grown in the regular medium for the crawling test, it was discovered that the average distance CA1 larvae crawled in 100 seconds was significantly shorter than that by GFP larvae (Figure 1c), indicating that there is a locomotion defect caused by expression of hCA1 in fly motor neurons during the larval development. Locomotion behavior was also tested in adult CA1 flies via the classic anti-geotaxis test every 3 days starting Day 2 after eclosion until Day 38. The climbing index was defined as the percentage of the numbers of flies reached the marked 5 cm distance at least once in 18 seconds in a vial, which is used as an indication of locomotion activity. It was discovered that the climbing index exhibited by CA1 flies was significantly lower than that of GFP flies as early as Day 8 (Figure 2a). The climbing index continued to decline in CA1 flies to be about 30.5% while GFP flies maintained an average climbing index value of 57.5% at Day 38 (Figure 2a). In other words, the locomotion activity in CA1 flies was about half of that of GFP flies between week 5 and week 6 in adult life. Consequently, CA1 flies had also shortened lifespan demonstrated by the reduced survival rate in the same period of time (Figure 2d). Therefore, we conclude that for the first time we have demonstrated that hCA1 when expressed in fly motor neuron can cause toxicity as reflected in the locomotion defect as well as the reduced rate of survival in adult flies.
CA1-induced motor neuron toxicity is activity-dependent
The next question we were interested in asking was whether the observed CA1-induced toxicity requires the enzymatic activity. To address this, transgenic flies expressing a mutant form of CA1 (E106I) with a mutation in the conserved amino acid residue Glu106 in the motor neurons were established. Mutations in Glu106 were known to inactivate CA [29] and the loss of enzymatic activity in E106I was also confirmed by the carbonic anhydrase activity assay (Figure S2). The mutant E106I expression was detected by the same CA1 antibody in individual flies (Figure 1a, lanes 6-9) and the level of E106I mutant protein is somewhat lower (about 70% of that of the wild-type CA1) when compared to CA1 expression (Figure 1b). In addition, the CA inhibitor acetazolamide (AAZ) was also included in the fly growth medium as an alternative way of inactivating the anhydrase activity in 3rd instar larvae for the crawling test (Figure 3a-3c). DMSO was included in the growth media as AAZ is only soluble in DMSO. While DMSO did not have any effect on the reduced locomotion activity in 3rd instar CA1 larvae compared with GFP flies (Compare Figure 1c with Figure 3a), AAZ at two different concentrations of either 1 µM or 10 µM eliminated such defect in CA1 larvae (Figure 3b and 3c, respectively). Similarly, larvae expressing E106I performed no differently from GFP larvae in the crawling distance, reversing the defect seen in CA1 larvae (Figure 3d, compare the purple with green). The anhydrase activity-dependent toxicity was also tested in the climbing assay and survival rate in adult flies. The E106I flies, virtually behaved the same as GFP flies with regard to both the climbing index (Figure 2c) and survival rate (Figure 2f) when compared with CA1 flies (Figure 2, compared 2a with 2b for climbing index; and compare 2d with 2e for the survival rate). Therefore, we conclude that CA1-induced toxicity in fly motor neurons requires its anhydrase activity.
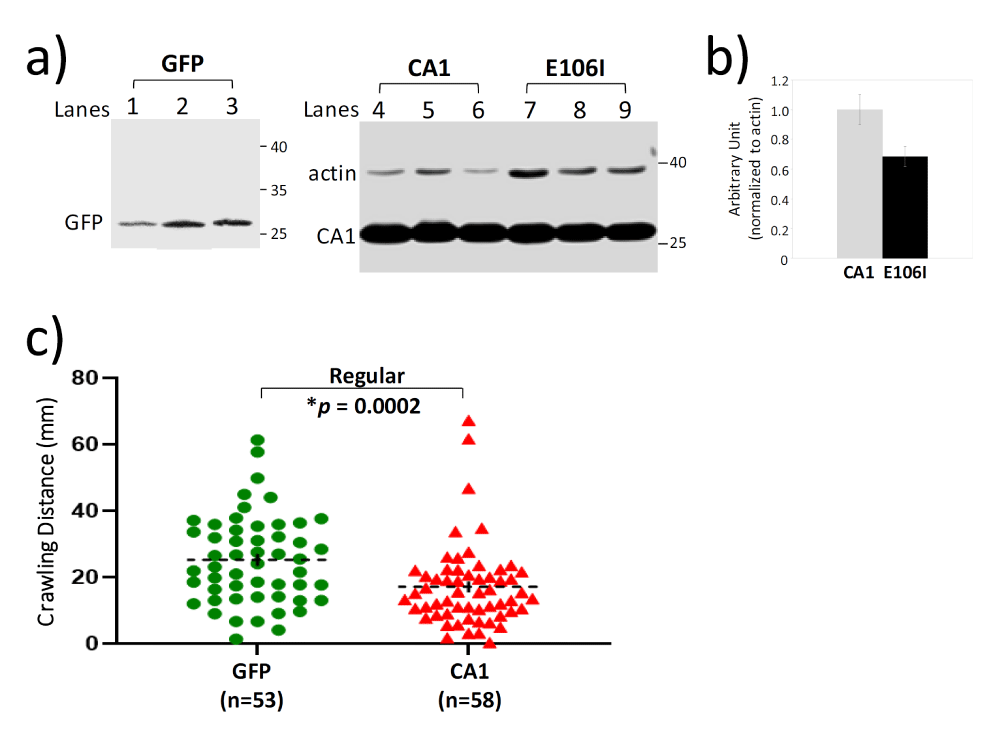
Figure 1: Confirmation of transgene expression in transgenic flies and CA1-induced locomotion defect at the larval stage. a) Western Blot analysis of transgene expression in individual flies from transgenic lines expressing GFP, CA1 and E106I. Each lane represents one fly and the lane is labelled numerically above the image. The blot was probed with antibodies against GFP (lanes 1-3) and CA1 and actin (lanes 4-9). The CA1 antibody used here also detected E106I mutant. MW standards are indicated by the numbers in kDa on the right side of the images. b) Quantitation of the levels of CA1 and E106I mutant expression in transgenic flies. c) The scatter plot of the crawling distances measured in 3rd instar GFP and CA1 larvae grown in regular media. The number of larvae used for each group is indicated by “n”. The p value was determined by one-way ANOVA analysis using non-parametric and Mann-Whitney tests. The dashed black lines represent Mean ± SE. “*” is used to indicate p < 0.05.
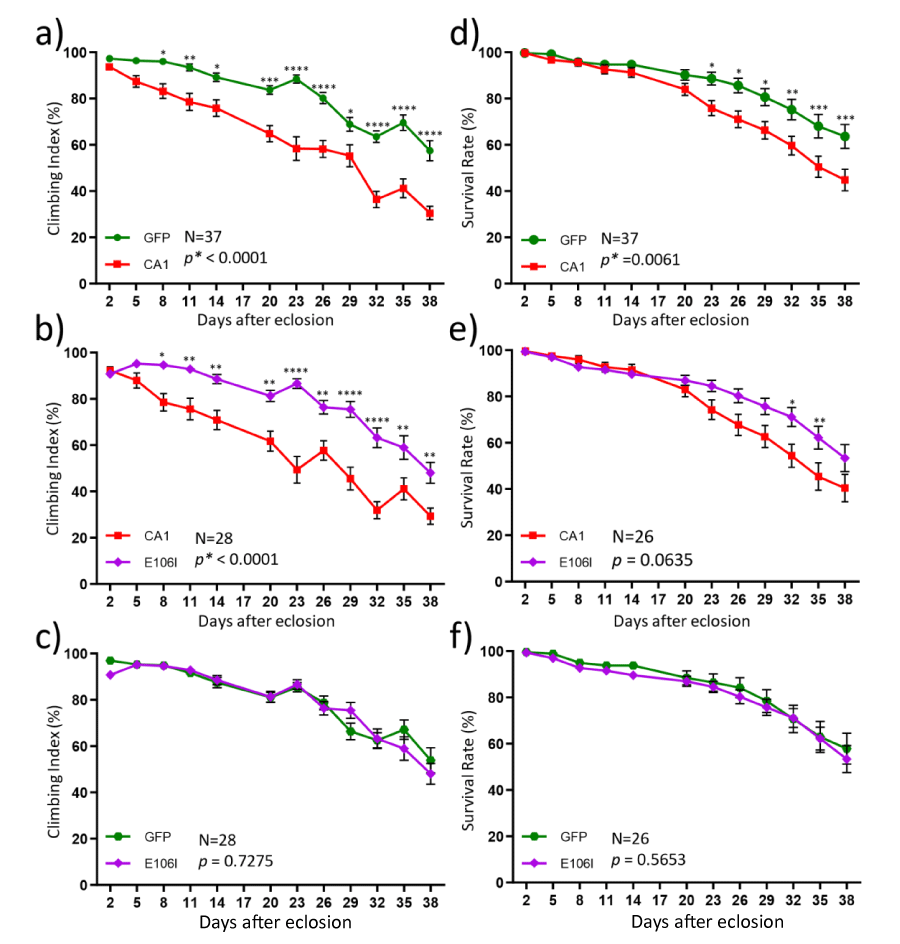
Figure 2: Motor neuron expression of CA1 caused the activity-dependent locomotion defect and reduced rate of survival in adult flies. Adult male flies from transgenic lines expressing GFP (green), wild-type CA1 (red) and the mutant E106I (purple) were subjected to the climbing (a-c) and survival (d-f) tests from Day 2 to Day 38 after eclosion. The number of fly vials used in the tests for a given two groups at each time point is indicated by “N”. Ten flies were collected for each vial on Day 1. The data for each graph were analyzed by two-way ANOVA followed by Bonferroni’s multiple comparisons test using the GraphPad Prism software. The significance of the difference between the two groups was indicated by the p value next to “N” in the graph area where “*” is used to indicate p < 0.05. The significance between two data points at a given time was also labeled by “*” in which: *: p < 0.05; **: p < 0.01, ***: p < 0.001; and ****: p < 0.0001, situated above each data point in the graph line. The data values and error bars represent Mean ± SEM.
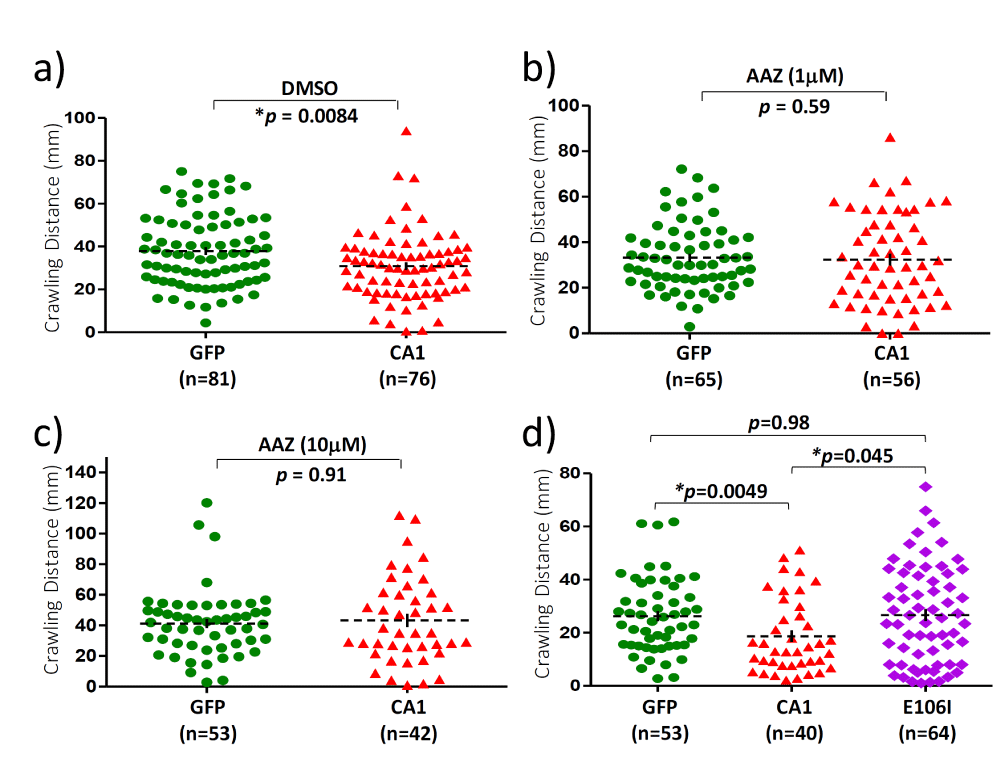
Figure 3: Motor neuron expression of CA1 caused activity-dependent locomotion defect in 3rd instar larvae. The scatter plots of the crawling distances measured in 3rd instar larvae. Crawling tests were conducted on 3rd instar larvae from transgenic flies expressing GFP (green), CA1 (red) and E106I proteins. Growth medium containing DMSO (a) and different concentrations of acetazolamide (AAZ), an inhibitor of CA1 were included. b) AAZ, 1mM; c) AAZ, 10 mM; d) Regular medium. The number of larvae used for each group is indicated by “n”. The p value was determined by one-way ANOVA analysis using non-parametric and Mann-Whitney tests. The dashed black lines represent Mean ± SE. “*” is used to indicate p < 0.05.
CA1 can ameliorate SOD1-induced toxicity at the early stage of adult flies
In order to understand the relationship between SOD1- and CA1-induced locomotion defects in adult flies which is relevant to the mechanisms of FALS-linked motor neuron toxicity, we also created transgenic flies expressing both SOD1 and CA1 in the motor neurons (described as CA1+SOD1 flies). Both the climbing and survival tests were conducted in a total of four transgenic fly lines expressing GFP, CA1, SOD1 and CA1+SOD1. The expression of the above transgene of interests in each transgenic fly line was confirmed by the Western Blot analysis (Figure 4). Expression of the mutant form of SOD1 (SOD1G85R) caused toxicity in the climbing test up to Day 14 (Figure 5a). However, this SOD1-induced toxicity plateaued and reached a significant beneficial effect compared with GFP flies at Day 38 (Figure 5a). In contrast and as described earlier, CA1 caused the continued decline in motor function compared with GFP flies (Figure 2a). Interestingly, when CA1 was expressed in addition to SOD1 in fly motor neurons, the locomotion activity in CA1+SOD1 flies was restored to that of the control GFP flies (Figure 5d and Figure S3C). This CA1-rescuing SOD1 toxicity and “returning to normalcy” was most unambiguously and clearly observed within the first 2 weeks or up to Day 14 (Figure 5b and Figure S3A). The rescue effect was two-edged in a sense that SOD1 also significantly rescued CA1-induced toxicity, as demonstrated by p=0.003, between CA1 and CA1+SOD1 flies in the same period of time (Figure 5c and Figure S3B). At the later stage of the adult fly life, particularly after Day 26, SOD1-induced toxicity plateaued while CA1 continued to be toxic (Figure 5e), with the former being dominant to the latter eliminating the CA1-induced toxicity completely to be no different from that of GFP flies (Figure 5c and 5d). This above statement is consistent with the enhanced p value (p<0.0001) between SOD1 and CA1+SOD1 flies within 14 days (Figure S3A) than p=0.0402 within 38 days (Figure 5b), while the p values for CA1 and CA1+SOD1 flies exhibited a reverse trend: p=0.003 and p<0.0001 within 14 and 38 days, respectively (Figure S3B and Figure 5c).
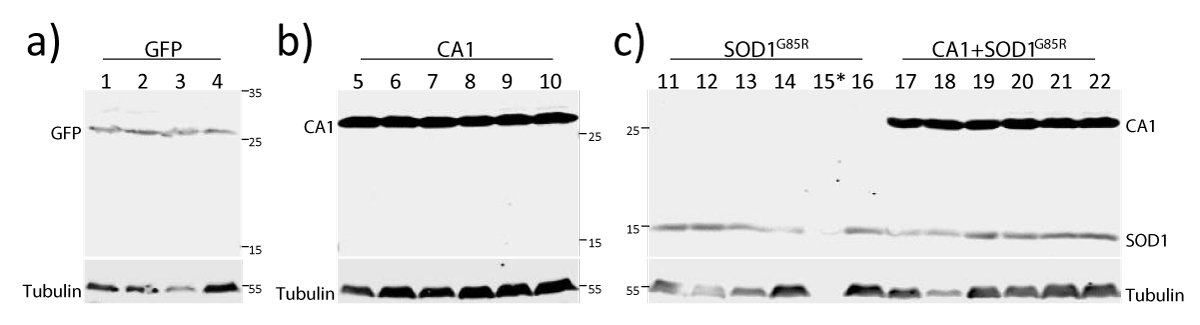
Figure 4: Confirmation of transgene expression in the four transgenic lines. Immunoblot analysis of proteins from individual flies from transgenic lines expressing GFP (lanes 1-4), CA1 (lanes 5-10), SOD1 (lanes 11-16), and CA1+SOD1 (lanes 17-22) in motor neurons. MW standards are indicated by numbers in kDa on the side of the images. The blot was probed with antibodies against GFP (a), CA1 (b), SOD1 and CA1 (c). All blots were also probed with the anti-tubulin antibody. * indicates the protein in Sample 15 was too low due to experimental variations.
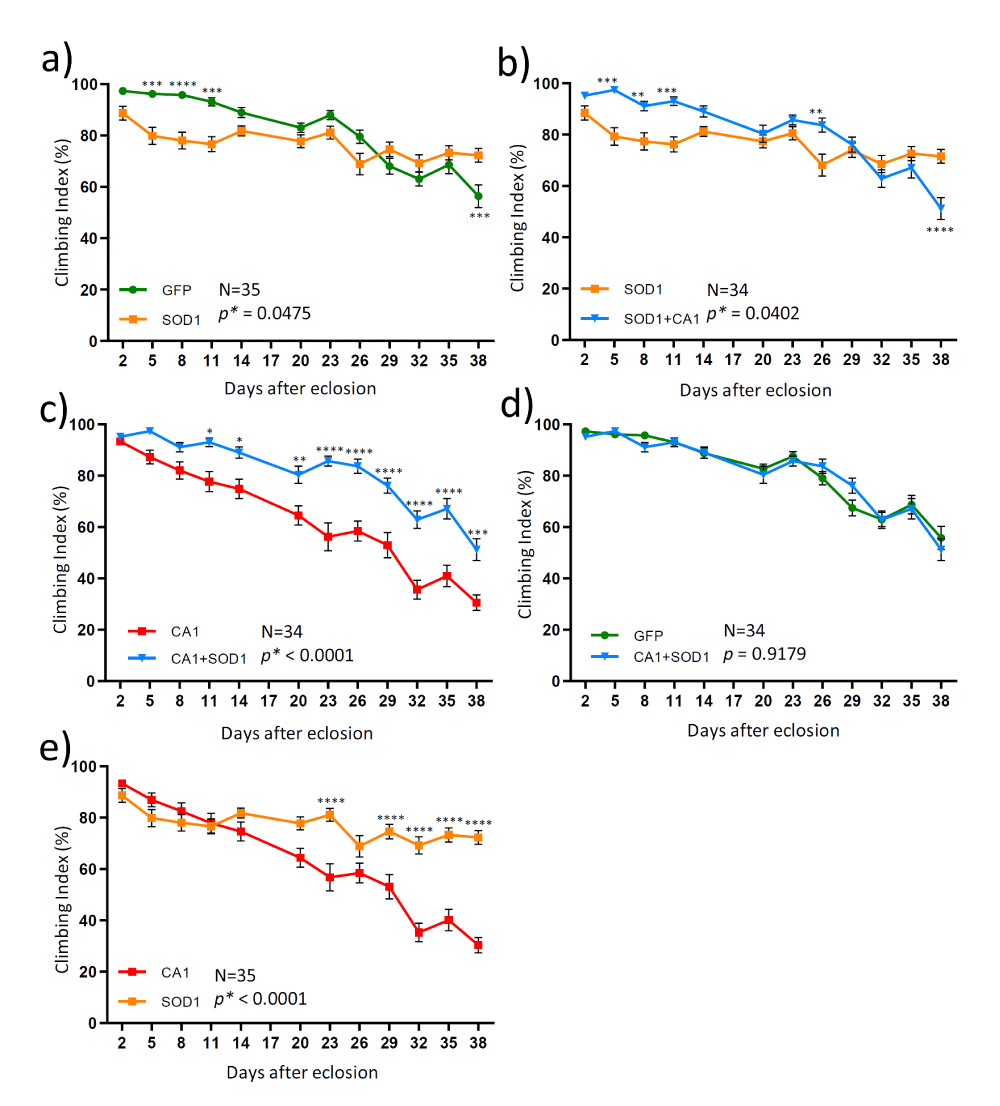
Figure 5: The time courses (from Day 2 to Day 38) of the locomotion activities measured in 4 different transgenic flies. The climbing test was performed in adult male flies from transgenic lines expressing a control protein GFP (green), CA1 (red); SOD1 (orange) and both CA1 and SOD1 (CA1+SOD1, blue). Each graph presented data comparison from two groups: a) GFP and SOD1; b) SOD1 and CA1+SOD1; c) CA1 and CA1+SOD1; d) GFP and CA1+SOD1; d) SOD1 and CA1. The number of vials of flies used in the test for a given two groups at each time point is indicated by “N”. Ten flies were collected for each vial at Day 1. Data for each graph were analyzed by two-way ANOVA followed by Bonferroni’s multiple comparisons test using the GraphPad Prism software. The significance of the difference between the two groups was indicated by the p value next to “N” in the graph area where “*” is used to indicate p < 0.05. The significance between two data points at a given time was also labeled by “*” in which: *: p < 0.05; **: p < 0.01, ***: p < 0.001; and ****: p < 0.0001, situated above each data point in the graph line. The data values and error bars represent Mean ± SEM.
The ER stress pathway is involved in SOD1- and CA1-induced toxicity
Due to the fact that there obviously is a crosstalk between SOD1- and CA1-induced motor neuron toxicity in adult flies, we first tested the possibility of whether there was either a direct or indirect interaction between SOD1 and CA1 by co-immunoprecipitation using proteins from fly tissues. We did not detect a potential interaction between the two proteins using this method (Figure S4). Studies with mammalian cells have established that almost all mutant SOD1s can gain toxicity by abnormally interacting with Derlin-1 which induced ER stresses leading to aggregates formation and activation of ASK1 [23]. In addition, the ER stress response is one of the earliest pathological features in mutant SOD1-linked FALS models in rodents [30]. To determine whether SOD1-induced motor neuron toxicity in flies may involve similar mechanisms, we hypothesized that the mutant SOD1 might also be able to interact with Drosophila Derlin-1 (dDerlin-1), as the sequence identified in hDerlin-1 which interacts with mutant SOD1s shares homology with the corresponding sequence in dDerlin-1 (Figure S5A). However, co-immunoprecipitation experiment did not yield positive interaction between the two proteins using either purified proteins (data not shown) or proteins from fly tissues (Figure S4, bottom panel; Figure S5B and S5C). Nevertheless, changes in the levels of molecules that are known to be upregulated in ER stress response were examined (Figure 6a). One of such molecule is eIF2α and its activation by phosphorylation (p-eIF2α). The temporal regulation of levels of p-eIF2α were determined in transgenic lines at Day 3, Day 14, and Day 26. For the first time, we documented an early and peak activation of eIF2α at Day 3 in SOD1 flies (Figure 6b, orange bars) which subsided to the level not different from that in GFP flies at Day 14 (Figure S6A, Day 14, green and orange bars). This is supportive of the notion that the ER stress pathway known to be engaged in mammalian cells [23], is also involved in mutant SOD1-induced toxicity in Drosophila, the latter of which has not been demonstrated before. Differently, a delayed activation of eIF2α was observed in CA1 flies which started to increase at Day 3 but peaked at Day 14 (Figure 6b, Day 14, red bars; Figure S6A, Day 14, green and red bars). In contrast, there is no detectable activation of eIF2α in CA1+SOD1 flies compared with GFP flies (Figure 6b, blue bars), suggesting that eIF2α activation can serve as an indication of the underlying mechanism that results in the counteractive effect of CA1- and SOD1-induced toxicity observed in early fly adulthood (Figure 5).
CA1- and SOD1-induced toxicity involves JNK activation
To understand the toxicity at the level of apoptosis, the changes in phosphorylated JNK (p-JNK) were also examined. Similar activation of JNK at Day 14 were observed in both CA1 and SOD1 flies (Figure 6c, red and orange bars) which again was not seen in CA1+SOD1 flies (Figure 6c, blue bars). This is consistent with the normal locomotion function observed in the climbing test in CA1+SOD1 flies until Day 14 (Figure 5). The activation of JNK in CA1 flies at Day 26 was not significantly different from Day 14 (Figure 6c, no significant difference for the red bars between Day 14 and Day 26), while in SOD1 flies, the activation of JNK was significantly decreased at Day 26 compared with Day 14 (Figure 6c, orange bars, p=0.03 between Day 14 and Day 26). These changes correlated with the sustained locomotion defect in CA1 throughout the time course while the defective behavior stabilized and ultimately improved in SOD1 flies when compared to GFP flies after Day 14 (Figure 2a and Figure 5a).
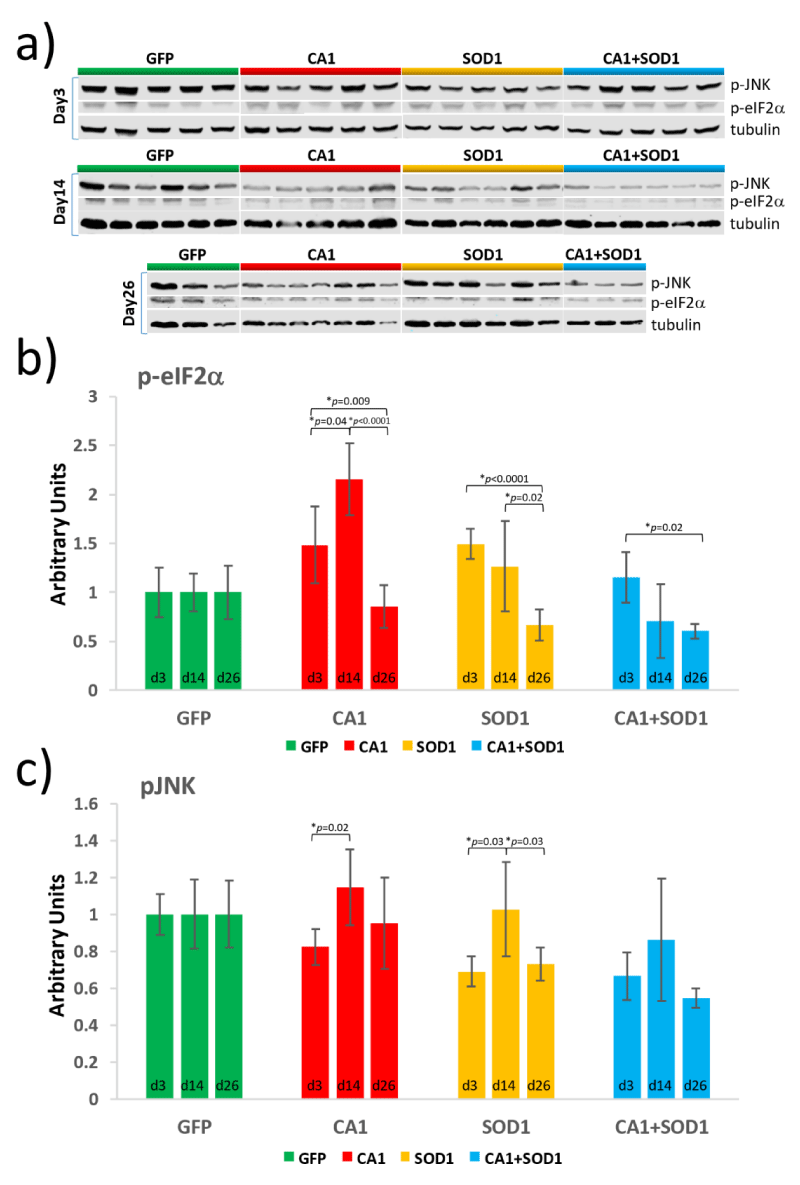
Figure 6: Quantitation of the levels of phosphorylated eIF2a and phosphorylated JNK in transgenic lines expressing GFP (green), CA1 (red), SOD1 (orange) and CA1+SOD1 (blue) at Day 3, 14 and 26. a) Western Blot analysis was performed with proteins from the fly head and trunk using antibodies against phosphorylated eIF2a (p-eIF2a), phosphorylated JNK (p-JNK), and tubulin. Each lane contains proteins from 10 individual flies. Graphs exhibiting temporal changes in p-eIFa (b) and p-JNK (c) for each transgenic line were shown. The intensity of the protein signal in each lane was quantified using the Image Studio Lite Ver 5.2 software and normalized to the level of tubulin. The p values were calculated using the Student T-test and labeled between 2 bars where p < 0.05 with “*”. The data values and error bars represent Mean ± SD.
Our study for the first time characterized a novel fly model of motor neuron toxicity that might be relevant to ALS. Previously discovered human CA1 whose levels were shown to be increased in the spinal cord of ALS patients [4], has now been demonstrated that when overexpressed in fly motor neurons is also toxic (Figure 2a & 2d). Among the established Drosophila models of ALS-linked genes, 5 molecules including SOD1, TDP-43, FUS and PFN1, when their wild-type human proteins were overexpressed in fly neurons caused toxicity [31,32,24]. Apparently, CA1 behaved similarly to these five molecules. Our approach in the effort to understand how CA1 might modulate motor neuron function is to see how it might affect a known ALS-related phenotype which human mutant SOD1-induced toxicity in fly motor neurons. It was noted that this SOD1-induced toxicity in our study was observed earlier (Figure 5a) than the published data [24]. This difference can be attributed to the different control used in the experiments. While flies overexpressing the endogenous fly SOD1 were use in the climbing test by Watson et al. [24], we used flies overexpressing GFP in our study. There definitely is a crosstalk between CA1-induced toxicity and SOD1-mediated pathway as demonstrated by the data in figure 5. The net result of this crosstalk is the reversal of two toxicities to normal, implying the mechanism of the individual toxicity can nullify each other. Such rescuing effect is of the similar nature to the published study in which the defect in axonal transport caused by a mutation in dynein completely rescued SOD1 mutant G93A-induced deficit in axonal transport seen in the transgenic mouse model of ALS, even though the molecular mechanism was not entirely clear [33]. In theory, there are at least two potential possibilities for such interaction. One is that there might be a shared and rate-limiting factor in the CA1- and SOD1-induced pathways. When both proteins are present, the amount of this factor is rendered to be insufficient for either pathway resulting in the disappearance of the toxicity. Second, there is a common factor or pathway affected by CA1 and SOD1 and for the normal cell function, the level of this factor or the active state of this pathway has to be maintained at an optimal value. An example of such factor is peripheral myelin protein-22 (PMP22) whose levels are tightly regulated. PMP22 is a component of myelin which covers the nerves and is responsible for the efficient transmission of neuronal impulses. Increased levels of PMP2 due to an additional copy of the PMP22 gene results in a neurological disorder known as Charcot-Marie-Tooth type 1A (CMT1A), while decreased levels PMP22 due to heterozygous deletion of the gene causes a different neurological disorder known as hereditary neuropathy with liability to pressure palsies (HNPP). If CA1 caused a change in the level of the factor or the degree of the active pathway in one direction, while SOD1 in the opposite direction, this can lead to disruption of the normal function. When both proteins are present, opposing effects on the changes of the factor /pathway resumes the optimal level of the condition and normal cellular function. Further investigations are needed to elucidate the mechanisms of this complex and interesting phenomenon of crosstalk between CA1 and SOD1-induced toxicity.
The fact that CA1 can modify SOD1-induced toxicity helped to test the hypothesis whether there might be a shared signaling pathway leading to motor neuron dysfunction. Although the physical interaction between SOD1 and dDerlin-1 was not detected in our study, we demonstrated that the ER stress response pathway was involved by the activation of eIF2α in SOD1 flies. This is consistent with the data in mammalian cells that ER stress-induced ASK1 activation was responsible for mutant SOD1-linked toxicity [23]. It is entirely possible that mutant SOD1 can physically engage with dDerlin-1 in a transient and/or regulated way (that was not detectable by the co-immunoprecipitation method) which leads to toxicity, or there is dDerlin-1-independent signaling pathway. On the other hand, it is equally possible that SOD1-induced toxicity in fly motor neurons is dDerlin-1-independent. Furthermore, the same activation of eIF2α was also detected in CA1-induced defect, but which peaked at a later time compared with that by SOD1 (Figure 6b, compare the red and yellow bars). In other words, an earlier rather than later ER stress response might be critical in determining whether the neurons are going to be able to overcome or succumb to the stresses. Indeed, it appeared that the quicker activation of eIF2α helped SOD1 neurons in the long run survive the stress (Figure 5a) while the relatively delayed eIF2α activation in CA1 flies resulted in persistent toxicity in motor neurons (Figure 2a). This type of correlation between the onset of ER stress response and cell survival was also reported by Walter et al., with regard to the kinetics of XBP1 splicing and ATF4 translation and their correlations with cell death [34]. The JNK pathway is known to be activated in response to stress and in Drosophila, activation of JNK is normally associated with apoptosis [35]. It is also known that ER stress can cause activation of JNK via TRAF2 and kinases complex including ASK1. Increased p-JNK levels were observed within CA1 and SOD1 flies at Day14, which can be potentially associated with eIF2a activation. However, no significant JNK activation was detected in CA1+SOD1 flies, which is consistent with the lack of locomotion defect in these flies, suggesting the toxicity seen in flies are potentially due to ER stress response and downstream activation of JNK signaling pathway. It was noted that CA1 and SOD1 flies exhibited lower levels of activation of JNK at Day 3 and Day 26 compared with GFP flies (Figure S6B). It is not clear what contributes to this lower level of p-JNK in CA1 or SOD1 flies. One might speculate that initial CA1- and SOD1-induced stress might pre-conditioned cells to lower the p-JNK levels to better cope with further activation. If so, the fact that the level of p-JNK in CA1+SOD1 flies was significant lower than either CA1 or SOD1 flies at Day 26 (Figure S6B, compare the blue to red or orange bars) would be consistent with the counteractive crosstalk between the two pathways resulting in even better coping mechanisms. These pure speculations warrant future investigations.
To summarize, our study for the first time confirmed that mutant SOD1 can induce ER stress response and JNK activation in fly motor neurons, which is consistent with the mechanisms elucidated in mammalian cells [36-40]. We also used the transgenic fly model to further characterize a recently reported molecule CA1 whose levels were changed in ALS patients and discovered that CA1 can induce ER stress response in fly motor neurons. Most importantly, CA1 can cancel out SOD1-linked ALS pathology in flies within the first two weeks in adulthood indicating that the potential crosstalk and time-sensitive interactions between signaling pathways induced by apparently different toxic proteins can benefit cells or organisms depending on the nature and kinetics of the associated cellular pathways. Such information is important and potentially useful for discovering drugs in therapeutic development.
We thank Dr. Minyan Wang for kindly providing the imaging system for the crawling test. We thank Professor Mu Wang for reading and providing critical comments on the manuscript. I hereby declare that this piece of work was partially or fully funded by National Natural Science Foundation of China with grant number: 81071010; Xi’an Jiaotong-Liverpool University with grant numbers: RDF-10-02-02 and RDF-14-01-21.
- Kiernan MC, Vucic S, Cheah BC, Turner MR, Eisen A, et al. Amyotrophic lateral sclerosis. Lancet. 2011; 377: 942-955. PubMed: https://www.ncbi.nlm.nih.gov/pubmed/21296405
- Mathis S, Goizet C, Soulages A, Vallat JM, Masson GL. Genetics of amyotrophic lateral sclerosis: A review. J Neurol Sci. 2019; 399: 217-226. PubMed: https://www.ncbi.nlm.nih.gov/pubmed/30870681
- Taylor JP, Brown RH Jr, Cleveland DW. Decoding ALS: from genes to mechanism. Nature. 2016; 539: 197-206. PubMed: https://www.ncbi.nlm.nih.gov/pubmed/27830784
- Liu X, Lu D, Bowser R, Liu J. Expression of Carbonic Anhydrase I in Motor Neurons and Alterations in ALS. Int J Mol Sci. 2016; 17. PubMed: https://www.ncbi.nlm.nih.gov/pubmed/27809276
- Tolvanen ME, Ortutay C, Barker HR, Aspatwar A, Patrikainen M, et al. Analysis of evolution of carbonic anhydrases IV and XV reveals a rich history of gene duplications and a new group of isozymes. Bioorg Med Chem. 2013; 21: 1503-1510. PubMed: https://www.ncbi.nlm.nih.gov/pubmed/23022279
- Frost SC. Physiological functions of the alpha class of carbonic anhydrases. Subcell Biochem. 2014; 75: 9-30. PubMed: https://www.ncbi.nlm.nih.gov/pubmed/24146372
- Syrjanen L, Tolvanen ME, Hilvo M, Vullo D, Carta F, et al. Characterization, bioinformatic analysis and dithiocarbamate inhibition studies of two new alpha-carbonic anhydrases, CAH1 and CAH2, from the fruit fly Drosophila melanogaster. Bioorg Med Chem. 2013; 21: 1516-1521. PubMed: https://www.ncbi.nlm.nih.gov/pubmed/22989910
- Overend G, Luo Y, Henderson L, Douglas AE, Davies SA, et al. Molecular mechanism and functional significance of acid generation in the Drosophila midgut. Sci Rep. 2016; 6: 27242. PubMed: https://www.ncbi.nlm.nih.gov/pubmed/27250760
- Chang X, Han J, Zhao Y, Yan X, Sun S, et al. Increased expression of carbonic anhydrase I in the synovium of patients with ankylosing spondylitis. BMC Musculoskelet Disord. 2010; 11: 279. PubMed: https://www.ncbi.nlm.nih.gov/pubmed/21143847
- Connor DE Jr, Chaitanya GV, Chittiboina P, McCarthy P, Scott LK, et al. Variations in the cerebrospinal fluid proteome following traumatic brain injury and subarachnoid hemorrhage. Pathophysiology. 2017; 24: 169-183. PubMed: https://www.ncbi.nlm.nih.gov/pubmed/28549769
- Gao BB, Clermont A, Rook S, Fonda SJ, Srinivasan VJ, et al. Extracellular carbonic anhydrase mediates hemorrhagic retinal and cerebral vascular permeability through prekallikrein activation. Nat Med. 2007; 13: 181-188. PubMed: https://www.ncbi.nlm.nih.gov/pubmed/17259996
- Johnston-Wilson NL, Sims CD, Hofmann JP, Anderson L, Shore AD, et al. Disease-specific alterations in frontal cortex brain proteins in schizophrenia, bipolar disorder, and major depressive disorder. The Stanley Neuropathology Consortium. Mol Psychiatry. 2000; 5: 142-149. PubMed: https://www.ncbi.nlm.nih.gov/pubmed/10822341
- Mentese A, Erkut N, Demir S, Yaman SO, Sumer A, et al. Serum carbonic anhydrase I and II autoantibodies in patients with chronic lymphocytic leukaemia. Cent Eur J Immunol. 2018; 43: 276-280. PubMed: https://www.ncbi.nlm.nih.gov/pubmed/30588172
- Mentese A, Fidan E, Alver A, Demir S, Yaman SO, et al. Detection of autoantibodies against carbonic anhydrase I and II in the plasma of patients with gastric cancer. Cent Eur J Immunol. 2017; 42: 73-77. PubMed: https://www.ncbi.nlm.nih.gov/pubmed/28680333
- Ruiz Esparza-Garrido R, Velazquez-Flores MA, Diegoperez-Ramirez J, López-Aguilar E, Siordia-Reyes G, et al. A proteomic approach of pediatric astrocytomas: MiRNAs and network insight. J Proteomics. 2013; 94: 162-175. PubMed: https://www.ncbi.nlm.nih.gov/pubmed/24060999
- Torella D, Ellison GM, Torella M, Vicinanza C, Aquila I, et al. Carbonic anhydrase activation is associated with worsened pathological remodeling in human ischemic diabetic cardiomyopathy. J Am Heart Assoc. 2014; 3: e000434. PubMed: https://www.ncbi.nlm.nih.gov/pubmed/24670789
- Visanji NP, Wong JC, Wang SX, Cappel B, Kleinschmidt-Demasters BK, et al. A proteomic analysis of pediatric seizure cases associated with astrocytic inclusions. Epilepsia. 2012; 53: 50-54. PubMed: https://www.ncbi.nlm.nih.gov/pubmed/22220588
- Yamanishi H, Murakami H, Ikeda Y, Abe M, Kumagi T, et al. Regulatory dendritic cells pulsed with carbonic anhydrase I protect mice from colitis induced by CD4+CD25- T cells. J Immunol. 2012; 188: 2164-2172. PubMed: https://www.ncbi.nlm.nih.gov/pubmed/22291189
- Rosen DR, Siddique T, Patterson D, et al. Mutations in Cu/Zn superoxide dismutase gene are associated with familial amyotrophic lateral sclerosis. Nature. 1993; 362: 59-62. PubMed: https://www.ncbi.nlm.nih.gov/pubmed/8332197
- Reaume AG, Elliott JL, Hoffman EK, Kowall NW, Ferrante RJ, et al. Motor neurons in Cu/Zn superoxide dismutase-deficient mice develop normally but exhibit enhanced cell death after axonal injury. Nat Genet. 1996; 13: 43-47. PubMed: https://www.ncbi.nlm.nih.gov/pubmed/8673102
- Saccon RA, Bunton-Stasyshyn RK, Fisher EM, Fratta P. Is SOD1 loss of function involved in amyotrophic lateral Sclerosis? Brain. 2013; 136: 2342-2358. PubMed: https://www.ncbi.nlm.nih.gov/pubmed/23687121
- Fujisawa T, Homma K, Yamaguchi N, Kadowaki H, Tsuburaya N, et al. A novel monoclonal antibody reveals a conformational alteration shared by amyotrophic lateral sclerosis-linked SOD1 mutants. Ann Neurol. 2012; 72: 739-749. PubMed: https://www.ncbi.nlm.nih.gov/pubmed/23280792
- Nishitoh H, Kadowaki H, Nagai A, Maruyama T, Yokota T, et al. ALS-linked mutant SOD1 induces ER stress- and ASK1-dependent motor neuron death by targeting Derlin-1. Genes Dev. 2008; 22: 1451-1464. PubMed: https://www.ncbi.nlm.nih.gov/pubmed/18519638
- Watson MR, Lagow RD, Xu K, Zhang B, Bonini NM. A drosophila model for amyotrophic lateral sclerosis reveals motor neuron damage by human SOD1. J Biol Chem. 2008; 283: 24972-24981. PubMed: https://www.ncbi.nlm.nih.gov/pubmed/18596033
- Sahin A, Held A, Bredvik K, Major P, Achilli TM, et al. Human SOD1 ALS Mutations in a Drosophila Knock-In Model Cause Severe Phenotypes and Reveal Dosage-Sensitive Gain- and Loss-of-Function Components. Genetics. 2017; 205: 707-723. PubMed: https://www.ncbi.nlm.nih.gov/pubmed/27974499
- Mohanty AK, Trehan AK. Puerperal uterine inversion: analysis of three cases managed by repositioning, and literature review. J Obstet Gynaecol. 1998; 18: 353-354. PubMed: https://www.ncbi.nlm.nih.gov/pubmed/15512108
- Romero E, Cha GH, Verstreken P, Ly CV, Hughes RE, et al. Suppression of neurodegeneration and increased neurotransmission caused by expanded full-length huntingtin accumulating in the cytoplasm. Neuron; 2008; 57: 27-40. PubMed: https://www.ncbi.nlm.nih.gov/pubmed/18184562
- Sanyal S. Genomic mapping and expression patterns of C380, OK6 and D42 enhancer trap lines in the larval nervous system of Drosophila. Gene Expr Patterns. 2009; 9: 371-380. PubMed: https://www.ncbi.nlm.nih.gov/pubmed/19602393
- Li J, Parker B, Martyn C, Natarajan C, Guo J. The PMP22 gene and its related diseases. Mol Neurobiol. 2013; 47: 673-698. PubMed: https://www.ncbi.nlm.nih.gov/pubmed/23224996
- Pun S, Santos AF, Saxena S, Xu L, Caroni P. Selective vulnerability and pruning of phasic motoneuron axons in motoneuron disease alleviated by CNTF. Nat Neurosci. 2006; 9: 408-419. PubMed: https://www.ncbi.nlm.nih.gov/pubmed/16474388
- Ratnaparkhi A, Lawless GM, Schweizer FE, Golshani P, Jackson GR. A Drosophila model of ALS: human ALS-associated mutation in VAP33A suggests a dominant negative mechanism. PLoS One. 2008; 3: e2334. PubMed: https://www.ncbi.nlm.nih.gov/pubmed/18523548
- Steyaert J, Scheveneels W, Vanneste J, Van Damme P, Robberecht W, et al. FUS-induced neurotoxicity in Drosophila is prevented by downregulating nucleocytoplasmic transport proteins. Hum Mol Genet. 2018; 27: 4103-4116. PubMed: https://www.ncbi.nlm.nih.gov/pubmed/30379317
- Kieran D, Hafezparast M, Bohnert S, Dick JR, Martin J, et al. A mutation in dynein rescues axonal transport defects and extends the life span of ALS mice. J Cell Biol. 2005; 169: 561-567. PubMed: https://www.ncbi.nlm.nih.gov/pubmed/15911875
- Wang W, Wen D, Duan W, Yin J, Cui C, et al. Systemic administration of scAAV9-IGF1 extends survival in SOD1(G93A) ALS mice via inhibiting p38 MAPK and the JNK-mediated apoptosis pathway. Brain Res Bull. 2018; 139: 203-210. PubMed: https://www.ncbi.nlm.nih.gov/pubmed/29499331
- Pinal N, Calleja M, Morata G. Pro-apoptotic and pro-proliferation functions of the JNK pathway of Drosophila: roles in cell competition, tumorigenesis and regeneration. Open Biol. 2019; 9: 180256. PubMed: https://www.ncbi.nlm.nih.gov/pubmed/30836847
- Li Y, Ray P, Rao EJ, Shi C, Guo W, et al. A Drosophila model for TDP-43 proteinopathy. Proc Natl Acad Sci USA. 2010; 107: 3169-3174. PubMed: https://www.ncbi.nlm.nih.gov/pubmed/20133767
- Liang Z, Xue Y, Behravan G, Jonsson BH, Lindskog S. Importance of the conserved active-site residues Tyr7, Glu106 and Thr199 for the catalytic function of human carbonic anhydrase II. Eur J Biochem. 1993; 211: 821-827. PubMed: https://www.ncbi.nlm.nih.gov/pubmed/8436138
- Liu D, Zhang M, Yin H. Signaling pathways involved in endoplasmic reticulum stress-induced neuronal apoptosis. Int J Neurosci. 2013; 123: 155-162. PubMed: https://www.ncbi.nlm.nih.gov/pubmed/23134425
- Walter F, Schmid J, Dussmann H, Concannon CG, Prehn JH et al. Imaging of single cell responses to ER stress indicates that the relative dynamics of IRE1/XBP1 and PERK/ATF4 signalling rather than a switch between signalling branches determine cell survival. Cell Death Differ. 2015; 22: 1502-1516. PubMed: https://www.ncbi.nlm.nih.gov/pubmed/25633195
- Wu CH, Giampetruzzi A, Tran H, Fallini C, Gao FB et al. A Drosophila model of ALS reveals a partial loss of function of causative human PFN1 mutants. Hum Mol Genet. 2017; 26: 2146-2155. PubMed: https://www.ncbi.nlm.nih.gov/pubmed/28379367