
More Information
Submitted: 14 April 2020 | Approved: 23 April 2020 | Published: 24 April 2020
How to cite this article: Saetia S, Rosas F, Ogata Y, Yoshimura N, Koike Y. Comparison of resting-state functional and effective connectivity between default mode network and memory encoding related areas. J Neurosci Neurol Disord. 2020; 4: 029-037.
DOI: 10.29328/journal.jnnd.1001031
ORCiD: orcid.org/0000-0001-6139-876X
Copyright License: © 2020 Saetia S, et al. This is an open access article distributed under the Creative Commons Attribution License, which permits unrestricted use, distribution, and reproduction in any medium, provided the original work is properly cited.

Comparison of resting-state functional and effective connectivity between default mode network and memory encoding related areas
Supat Saetia1*, Fernando Rosas2, Yousuke Ogata1, Natsue Yoshimura3 and Yasuharu Koike1
1Department of Information Processing, Interdisciplinary Graduate School of Science and Engineering, Tokyo Institute of Technology, 4259 Nagatsuta-cho, Midori-ku, Yokohama, Kanagawa 226-8503, Japan
2Center for Psychedelic Research, Department of Medicine, Centre for Complexity Science and Department of Mathematics, Data Science Institute, Imperial College London, South Kensington, London SW7 2AZ, United Kingdom
3Precursory Research for Embryonic Science and Technology (PRESTO) Japan Science and Technology Agency (JST), 4-1-8, Honcho, Kawaguchi-shi, Saitama 332-0012, Japan
*Address for Correspondence: Supat Saetia, Department of Information Processing, Interdisciplinary Graduate School of Science and Engineering, Tokyo Institute of Technology, 4259 Nagatsuta-cho, Midori-ku, Yokohama, Kanagawa 226-8503, Japan, Tel: 045-924-5054; Email: [email protected]
Currently brain connectivity modelling, constructed from data acquired by non-invasive technique such as functional magnetic resonance imaging (fMRI), is a well-received approach to illustrate brain function. However, not all connectivity models contains equal amount of information. There are two types of connectivity model that could be constructed from fMRI data, functional and effective connectivity. Effective connectivity includes information about the direction of the connection, while functional connectivity does not. This makes interpretation of effective connectivity more meaningful than functional connectivity. The objective of this study is to show the improvement in interpretability of effective connectivity model in comparison to functional connectivity model. In this study, we show how the difference in the information contained within these two model impacts the interpretation of the resulting connectivity model by analyzing resting-state fMRI data on episodic memory-related cognitive function using CONN Toolbox bivariate correlation measurement for functional connectivity analysis and Tigramite causal discovery framework for effective connectivity analysis on an episodic memory related resting-state fMRI dataset. The comparison between functional and effective connectivity results show that effective connectivity contains more information than the functional connectivity, and the difference in the information contained within these two types of model could significantly impact the intepretation of true brain function. In conclusion, we show that for the connectivity between specific pair of brain regions, effective connectivity analysis reveals more informative characteristic of the connectivity in comparison to functional connectivity where the depicted connectivity lack any additional characteristic information such as the direction of the connection or whether it is a unidirectional or bidirectional. These additional information improve interpretability of brain connectivity study. Thus, we would like to emphasis the important of brain function study using effective connectivity modelling to obtain valid interpretation of true brain function as currently a large body of research in this field focuses only on functional connectivity model.
Humanity has invented writing to physically represent and record ideas or experience, to preserve and pass on to others or to the next generation, thus initiate the historical age of humankind. Since then, human invented several means of representing and recording information beyond conceptual representation, such as words and letters. Modern day human even has medium to store accurate representation of visual and auditory information.
Episodic memory is a memory of autobiographical events which is a memory of personal events, times, places, and associated with emotion and other contextual knowledge. With this kind of memory, a person can remember personal experience and consciously aware of the certain situation at a certain time of that event [1]. This episodic memory is a part of declarative memory, a category of long-term memory [2]. It is unique because it is often represented in form of visual information in order of event occurrence on personal timeline with memory owner as a perspective observer. This cognitive function is important because it enables human to project oneself backward in time and recall several aspects of one experience. This ability becomes the source of self-awareness and induces intelligence which set human apart from other animals.
Illustrating how brain works for a specific cognitive function is a challenging task. Currently available technologies for observing brain function non-invasively is limited, and the signal acquired is indirect. One of the most prominent technology in this field is functional magnetic resonance imaging (fMRI). The fMRI technology has enabled the observation of regional brain activation by detecting the amount of oxygen presence in blood in each particular part of the brain, on the principle that the region that is working is consumes oxygen for energy. This allows the chronological observation of brain regional activations, and by plotting those regional activations through time, we can assume information pathways from region to region inside the brain during any particular cognitive task. These pathways are the brain connectivity.
Since brain activity cannot be observed physically, the brain connectivity is a useful tool to model its mechanism. A connectivity model or a network is a mathematical representation of a real-world complex system denoted by a collection of nodes and links between pairs of nodes [3]. Nodes usually represent brain region, and links represent connection between regions. The model illustrates how each regions of the brain interact with each other and shows how informations, in form of neuronal signal, flow through them. Combined with the background knowledge of each particular region’s responsibility to certain lower cognitive function, the mechanism of higher cognitive function can be inferred. There are 3 types of connection, anatomical, functional and effective connection. The anatomical connection is an actual physical link between regions by biological pathway. The functional connection is undirected connection represents correlated activity between brain regions, while the effective connection is directed connection represents causal activity between brain regions [4].
The anatomical connectivity is the most straight forward of all 3 connectivities in terms of inferring and interpreting connectivity model, because there are physical evidences and measurable signals as ground truth, albeit postmortem pathological study of neuronal structure or invasive procedure on live patient are usually required. Contrarily, functional and effective connectivity usually derived from non-invasive measurement and they are hypothetical connections. It is usually controversial to infer solid conclusion from hypothetical connections as there is no ground truth to support the inference, thus limiting our ability to make meaningful interpretation of these connectivities. Confounding factors present due to limitation of non-invasive measurement, such as scanner noise, subject motion, physiological artefacts, or coregistration accuracy, further reduce the reliability of the resulting connectivity model.
There are several mathematical frameworks or algorithms that can be applied to mine both functional and effective connectivity out of fMRI blood-oxygen-level-dependent (BOLD) signal. The example of such algorithm is Granger causality. Granger causality [5] is a mathematical framework commonly employed to model causality of the neuronal activity from fMRI BOLD signal. The underlying assumption of this framework is that if X➝Y if and only if a change in X has an effect on Y [6]. However, all we can imply from observational data are statistical dependencies. Inferring and interpreting causal relationship is controversial. Moreover, the fact that fMRI BOLD signal is an indirect measurement of actual neuronal signal further confounds the inference.
Regardless of fMRI technological limitation, there are attempts and progresses in research and development of framework to extract connectivity information from fMRI BOLD signal. CONN toolbox is a MATLAB toolbox designed to analyze functional connectivity from BOLD signals. This toolbox emphasis on preprocess the signals to make it suitable for functional connectivity analysis. Primary concern of signal preprocessing for conventional fMRI analysis is spatial preprocessing, such as, slice-timing correction to correct time lag between each slice acquisition, and realignment to correct displacement between slices caused by subject’s movement. However, in case of connectivity analysis, temporal aspect of the signal is also a concern, because connectivity analysis is temporal sensitive. Global signal regression can be used to remove temporal noise, but it is known to introduce negative correlation in the connectivity result which reduces its interpretability. CONN toolbox avoid that issue by utilizing component-based noise correction method (CompCor) instead of global signal regression, which increase sensitivity and specificity of functional connectivity, thus allow for better interpretability [7].
Additional to a software designed specifically for fMRI connectivity analysis, any causal analysis framework has potential to carry out the task as well. Tigramite is a time-lagged causal discovery framework [8]. Compare to Granger causality, this framework relies on different set of assumptions to identify a causal graph. It performs conditional independence testing using the assumptions of time-order, Causal Sufficiency, the Causal Markov Condition, and Faithfulness, among others [9], hence improve causal interpretability in comparison to Granger causality. Beside conventional fMRI analysis, resting-state fMRI is gaining more and more attention in recent year. In contrast to conventional fMRI which the experiment design revolves around block- or event-related task, resting-state fMRI is a model-free analysis for any steady-state fMRI dataset. It increases analytic options for describing the functional organization of the brain [10]. In this work, we compared resting-state functional connectivity model from CONN toolbox and effective connectivity model using Tigramite framework. Functional connectivity models only consider temporal correlation (undirected connection) while effective connectivity models consider temporal causality (directed connectivity). Additional information obtained from directed connectivity may improve fMRI connectivity interpretability, which is a major controversial in the field of brain connectivity modeling [11].
Subjects
This study contains data from 120 subjects (of all 149 participants, 1 was removed for biased questionnaire responses, 3 were removed due to data incompletion, and 12 participants voluntarily withdrew from the study). The subject group included in this study consists of 68 females and 52 males. Minimum age is 45 year-old and maximum is 65 year-old (Mean: 55.03, SD: 6.07).
Experiment design
A behavioral test was used to evaluate episodic memory recollection capabilities of the subjects. Stimuli were presented to the subjects to invoke episodic recollection. Stimulus used in this study was 3-word tuple cue consisted of descriptive time, place, and action. This word combination was used to stimulate subject’s episodic recollection because they are basic elements of episodic memory [1]. Each trial consisted of 30 cues. Each cue had 2 corresponding responses, difficulty of recollection and confidence of recollection.
There were 3 phases in a single resting-state fMRI data acquisition session, pre resting-state fMRI, resting-state fMRI, and post resting-state fMRI. In pre resting-state fMRI phase, a set of 30 stimuli was presented to the subject. The subject did not need to respond to any of the stimuli in this phase. The pre phase was then followed by 10 minutes resting-state fMRI acquisition session, where the subject was asked to lie still inside fMRI scanner and to refrain from performing any cognitive task. In post phase, the same set of stimuli presented to the subject during the pre-phase was presented to the subject. In this phase, the subject responded to each stimulus by performing self-assessment of difficulty and confidence in episodic memory recollection of the corresponding scenario associated with each stimulus. The summary of the paradigm is shown in figure 1.
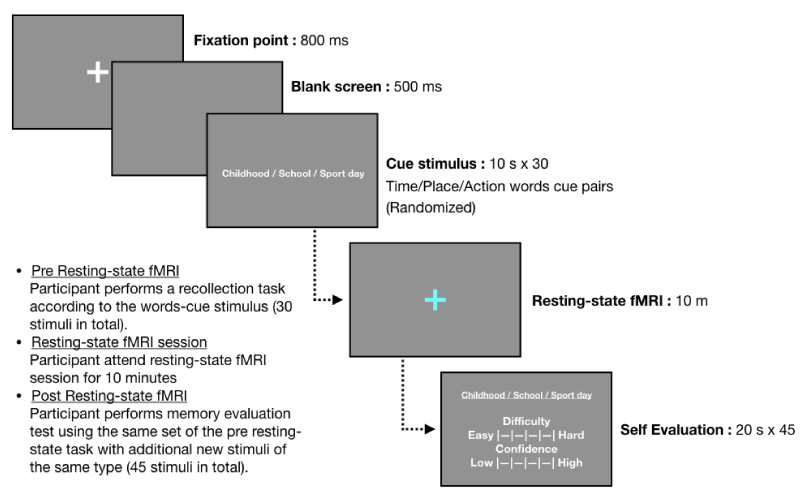
Figure 1: Resting-state fMRI session paradigm.
Data acquisition
Stimuli and self-assessment questionnaires were presented to subjects using ‘Presentation’ stimulus delivery program (Neurobehavioral Systems Inc, Albany, CA, USA). In pre phase, a white fixate crosshair was displayed for 500 ms, followed by 500 ms blank screen, then word-combination cue was displayed for 10s. During resting-state fMRI scan session, a blue fixate crosshair was displayed to the subject. The subject had not been given any instruction to perform any physical or cognitive task. In post phase, word-combination cue was displayed along with self-assessment question for 20s. The response was in 1 to 5 integer scale. The subject responded to the question by pressing corresponding numeric button on keyboard. In addition to 30 stimuli presented during pre-phase, 10 novel stimuli and 5 attention checking stimuli were added to post phase.
Resting-state fMRI was performed on 3 T MR Scanner (Siemens). Forty continuous axial slices (slice thickness 3.2 mm, 0.8 mm gap) were acquired in each volume using a T2*-sensitive gradient echoplanar imaging sequence (TR: 2,500 ms, TE: 30 ms, flip angle: 80, FOV: 212 mm; 212 mm).
fMRI data preprocessing
The fMRI data in this study were preprocessed through CONN toolbox standard preprocessing pipeline. The pipeline utilizes SPM8 for spatial preprocessing which includes slice-timing correction, realignment, normalization, and smoothing (8-mm FWHM Gaussian filter). Temporal preprocessing is done using component-based noise correction (CompCor) implementation of CONN toolbox. The temporal covariates removed by linear regression are the estimated subject motion (three-rotation and three translation parameter, and another six parameters representing their first-order temporal derivatives), the BOLD time-series within the subject-specific white matter mask (three PCA parameters), and cerebrospinal fluid (CSF) mask (three PCA parameters). The resulting residual BOLD time-series were band-pass filtered at 0.01 Hz < f < 0.10 Hz [7].
ROI BOLD extraction
The region of interest (ROI) BOLD signals used in both CONN and Tigramite analysis were extracted using CONN toolbox’s preprocessing pipeline. The ROI BOLD signals were average BOLD time-series computed across all the voxel within the ROI. The ROIs were defined by Harvard-Oxford Atlas. Ten ROIs were selected for connectivity analysis (Table 1). The selected ROIs consisted of Default Mode networks and area that are known to be responsible for episodic memory related cognitive functions [12]. Those regions were selected for this study to model the memory-related connectivity that shows the interaction among those region in relation to our memory-related cognitive function of interest.
| Table 1: Selected regions of interest (Harvard-Oxford cortical structural probability atlases). | ||
| Hemisphere | Region | Abbreviation |
| Right | hippocampus | Hippocampus r |
| Left | hippocampus | Hippocampus l |
| Right | anterior parahippocampal cortex | aPaHC r |
| Left | anterior parahippocampal cortex | aPaHC l |
| Right | posterior parahippocampal cortex | pPaHC r |
| Left | posterior parahippocampal cortex | pPaHC l |
| - | medial prefrontal cortex Default Mode network | networks.DefaultMode.MPFC |
| Right | lateral parietal Default Mode network | networks.DefaultMode.LP (R) |
| Left | lateral parietal Default Mode network | networks.DefaultMode.LP (L) |
| - | posterior cingulate cortex Default Mode network | networks.DefaultMode.PCC |
Behavioral test
Self-assessment memory recollection test questionnaire was used to evaluate subject’s episodic recollection ability. The assessment measures 2 parameters, difficulty in performing recollection, and confidence of the accuracy of the content of the recollection. The difficulty level indicates how much effort the subject has to assert in order to recall a memory of particular scenario specified by the stimulus. The confidence level indicates how certain the subject feel about the accuracy of the recalled memory. The assessment results were used as between-subject contrast for group-level analysis.
CONN ROI-to-ROI analysis
All aforementioned 10 ROIs (Table 1) were used as seeds for this analysis to estimate the ROI-to-ROI functional connectivity (bivariate correlation measure) among these ROIs. Between-subjects contrast is defined by behavioral results from memory recollection test.
The second-level between subject contrasts was determined by memory recollection self-assessment questionnaire with 2 parameters, recollection difficulty and confidence. The difficulty shows how much effort the subject need to assert to recall the memory. The confidence shows how much confidence the subject has in regard of the accuracy of the recalled memory. The self-assessed confidence level is shown to be associated with episodic memory retrieval performance [13].
Tigramite analysis
We model causal relation among 10 ROIs (Table 1) for each individual subjects using Tigramite causal time series analysis software package. It is a time-lagged causal discovery frameworks [9]. There are 2 free parameters for the algorithm, the maximum time lag τmax, and the significance threshold τmax in the condition-selection step. To determine maximum time lag τmax, we estimated lagged unconditional dependencies of the BOLD time-series and found the dependencies diminish beyond a lag of 8. The significance threshold was set to 0.1. The α is a regularization parameter in model-selection techniques, and should not be seen as significance test level in the condition-selection step [14]. Group representative model was constructed by median aggregation of connection weight of corresponding link of each individual connectivity graph. We used median to reduce the effect of outliers.
Spontaneous BOLD fluctuations in resting-state connectivity model
The spontaneous BOLD fluctuations or spontaneous neuronal activity is brain activity that is not associated to any specific input or output. It is usually observable in resting-state fMRI data since the resting-state data acquisition protocol attempts to minimize both sensory input and subject response, the subject is also asked to refrain from performing cognitive task. Thus, the spontaneous BOLD fluctuation represents intrinsic neuronal activity generated by brain [15]. In traditional task-related fMRI study, this fluctuation is eliminated by process of averaging across many trials along with other physiological artefacts, such as cardiac or respiratory activity, and non-physiological artefacts, such as scanner instability.
It is reasonable to eliminate spontaneous BOLD fluctuation from tradition task-related fMRI study because it increases confidence that the effect being studied is related to the task. However, in resting-state connectivity study, eliminating the fluctuation along with other artefacts poses a potential risk of decreasing validity. Thus, spontaneous BOLD fluctuation is crucial to resting-state connectivity modelling. The major concern for spontaneous BOLD data acquisition is to ensure that the results are not contaminated by or originated from spurious sources of variance BOLD, or other artefacts. CONN toolbox [7] address this issue by proposed and implemented an anatomical component-based noise correction method (aCompCor) [16], which not only increase the validity, but also the sensitivity and specificity of the connectivity analysis.
Several studies have shown that many neuro-anatomical systems is coherent in their spontaneous activity [15] including task-negative/default mode [17-20], hippocampus or episodic memory [21,22]. The evidence of coherent of spontaneous BOLD fluctuation is also observable in functional connectivity analysis of this study, the temporal correlations between spatial coherence are shown by connections of hippocapus, anterior parahippocampal cortex, and lateral parietal Default Mode network (Table 2). The coherent connections of hippocampus, and lateral parietal Default Mode network also presence in resulting effective connectivity analysis. Additionally, coherent connection of posterior parahippocampal cortex is also in the effective connectivity model with the absence of connection of anterior parahippocampal cortex. We will discuss about the difference of resulting functional and effective connectivity in the next section.
| Table 2: Consolidated top 10 ROI-to-ROI connections by intensity. (Thresholded at FDR-corrected p < 0.05). | ||
| ROI | ROI | Intensity |
| Hippocampus l | Hippocampus r | 36.82 |
| pPaHC r | pPaHC l | 33.38 |
| networks.DefaultMode.LP (L) | networks.DefaultMode.LP (R) | 30.37 |
| networks.DefaultMode.PCC | networks.DefaultMode.LP (R) | 26.78 |
| Hippocampus l | pPaHC l | 24.17 |
| networks.DefaultMode.LP (L) | networks.DefaultMode.PCC | 21.72 |
| pPaHC r | Hippocampus r | 21.38 |
| pPaHC l | Hippocampus r | 20.32 |
| pPaHC r | Hippocampus l | 19.55 |
| networks.DefaultMode.MPFC | networks.DefaultMode.PCC | 17.18 |
Functional and effective connectivity
Functional connectivity is defined as the temporal correlation among the activity of different brain area. Effective connectivity is defined as the causal relation among the activity of different brain areas [23]. The fundamental difference between functional and effective connectivity is the temporal implication of the source of the effect. Consider the simplified connectivity of brain regions X, Y, and Z, functional connection between X and Y implies region X’s activity temporally correlated to activity of region Y. However, there is a possibility that this correlation is cause by region X and region Y react to the input from the region Z. The disregard of temporal order in functional connectivity analysis decreases the validity of the interpretation of the resulting connectivity. On the other hand, the effective connectivity considers temporal order of the source and destination of the connection, thus, improve the validity of the connectivity intepretation.
This aspect is especially important when analyzing the connectivity from fMRI BOLD signals because the low temporal resolution nature of the BOLD signal and other confounding factor, such as, movement and physiological artefacts. In [7], the authors emphasis the importance of temporal preprocessing step on BOLD signal in addition to traditional spatial preprocessing step of fMRI study to remove temporal confounding factors. Inadequate noise reduction of BOLD data may result in spurious connections in both functional and effective connectivity which could lead to faulty intepreation of the connectivity of interest. Both functional and effective connectivities in this study used the same CONN toolbox preprocessing pipeling to preprocess BOLD signals before connectivity analysis.
CONN toolbox was used to analyze functional connectivity in this study. It utilizes seed-based correlation framework to determine functional connectivity in individual-level analysis, then the resulting measures are input into a second-level general linear model to obtain population-level result. The seed-based correlation analysis obtains a full connectivity model by iteratively input each ROI as a seed to analyzing correlation between it and other ROIs, then combine all of the seed connections together. This approach does not take temporal order relation between each seed into account.
For effective connectivity analysis, we utilized Tigramite, a time-lagged causal discovery framework [8] to analyze effective connectivity from the preprocessed BOLD signals. This framework differ from CONN toolbox approach in that it considers time-lagged, or temporal order of each connectivity as shown in figure 2. The lagged unconditional dependencies of the BOLD time-series is estimated to determine the time point when the dependencies diminish. The framework then estimates the connectivity along the lagged time, thus achieving temporal-ordered connectivity, or effective connectivity. The population-level connectivity was calculated by median aggregation of individual subject’s connectivity.
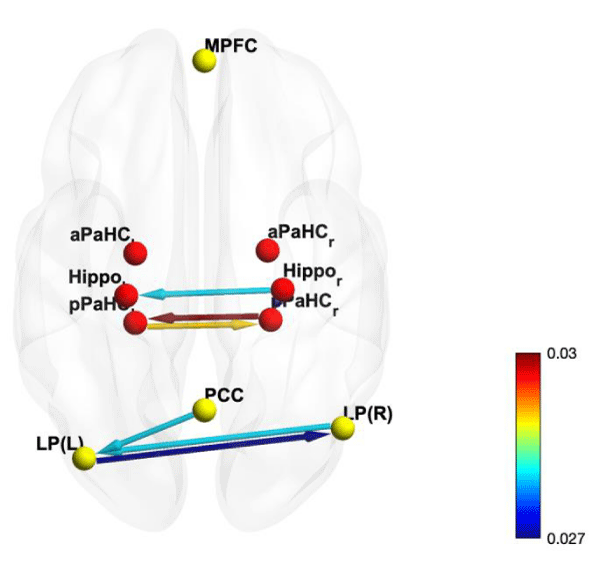
Figure 2: Tigramite graphic model of resting-state fMRI connectivity with 10 seed area. Results are threshold at FDR-corrected p < 0.05.
Comparing the resulting connections from these analyses (Tables 3,4), we can clearly see that the effective connectivity yields more concise connectivity as most low intensity connections were eliminated and the result from Tigramite also provide directional (causal relation) information between the connected brain regions. For example, we can see that coherent connection of posterior parahippocampal cortex and lateral parietal Default Mode network are bidirectional (Figure 2), while what we can inferred from functional connectivity as a coherent connection of hippocampus is just a connection from right hippocampus to left hippocampus (Figure 3). The advantages of having directional information also apply to the connection from right hippocampus (Hippo r) to right posterior parahippocampal cortex (pPaHC r), and from posterior cingulate cortex Default Mode network (PCC) to left lateral parietal Default Mode network (LP(L)), including coherent connection between 2 hippocampi (Hippo r and Hippo l). This additional information gives effective connectivity advantage in term of interpretability in comparison to functional connectivity, as these 3 aforementioned connections are not difference from other connections, however in effective connectivity model, these 3 connections are unidirectional while the rest are bidirectional.
| Table 3: CONN ROI-to-ROI connection weight. (thresholded at FDR-corrected p < 0.05). Header row represents source region and header column represent destination region. Refer to brain region abbreviation in table 2. | ||||||||||
| Hippo l | Hippo r | aPaHC l | aPaHC r | pPaHC l | pPaHC r | LP (L) | LP (R) | MPFC | PCC | |
| Hippo l | 0.00 | 36.82 | 15.96 | 12.99 | 24.17 | 19.55 | 10.58 | 9.48 | 14.55 | 7.07 |
| Hippo r | 36.82 | 0.00 | 15.03 | 16.29 | 20.32 | 21.38 | 8.98 | 8.92 | 13.65 | 6.26 |
| aPaHC l | 15.96 | 15.03 | 0.00 | 17.13 | 13.18 | 10.89 | 6.34 | 4.51 | 6.95 | 4.49 |
| aPaHC r | 12.99 | 16.29 | 17.13 | 0.00 | 12.74 | 13.58 | 6.40 | 7.05 | 9.03 | 5.16 |
| pPaHC l | 24.17 | 20.32 | 13.18 | 12.74 | 0.00 | 33.38 | 15.44 | 14.15 | 11.78 | 17.13 |
| pPaHC r | 19.55 | 21.38 | 10.89 | 13.58 | 33.38 | 0.00 | 13.04 | 12.19 | 8.13 | 13.35 |
| LP (L) | 10.58 | 8.98 | 6.34 | 6.40 | 15.44 | 13.04 | 0.00 | 30.37 | 10.36 | 21.72 |
| LP (R) | 9.48 | 8.92 | 4.51 | 7.05 | 14.15 | 12.19 | 30.37 | 0.00 | 14.40 | 26.78 |
| MPFC | 14.55 | 13.65 | 6.95 | 9.03 | 11.78 | 8.13 | 10.36 | 14.40 | 0.00 | 17.18 |
| PCC | 7.07 | 6.26 | 4.49 | 5.16 | 17.13 | 13.35 | 21.72 | 26.78 | 17.18 | 0.00 |
| Table 4: Group Tigramite connection weight. (threshold at FDR-corrected p < 0.05). Header row represents source region and header column represent destination region. Refer to abbreviation of brain region in table 2. | ||||||||||
| Hippo l | Hippo r | aPaHC l | aPaHC r | pPaHC l | pPaHC r | LP (L) | LP (R) | MPFC | PCC | |
| Hippo l | -0.051 | 0.000 | 0.000 | 0.000 | 0.000 | 0.000 | 0.000 | 0.000 | 0.000 | 0.000 |
| Hippo r | 0.028 | -0.052 | 0.000 | 0.000 | 0.000 | 0.027 | 0.000 | 0.000 | 0.000 | 0.000 |
| aPaHC l | 0.000 | 0.000 | -0.239 | 0.000 | 0.000 | 0.000 | 0.000 | 0.000 | 0.000 | 0.000 |
| aPaHC r | 0.000 | 0.000 | 0.000 | 0.007 | 0.000 | 0.000 | 0.000 | 0.000 | 0.000 | 0.000 |
| pPaHC l | 0.000 | 0.000 | 0.000 | 0.000 | 0.004 | 0.029 | 0.000 | 0.000 | 0.000 | 0.000 |
| pPaHC r | 0.000 | 0.000 | 0.000 | 0.000 | 0.030 | -0.067 | 0.000 | 0.000 | 0.000 | 0.000 |
| LP (L) | 0.000 | 0.000 | 0.000 | 0.000 | 0.000 | 0.000 | 0.034 | 0.027 | 0.000 | 0.000 |
| LP (R) | 0.000 | 0.000 | 0.000 | 0.000 | 0.000 | 0.000 | 0.028 | -0.055 | 0.000 | 0.000 |
| MPFC | 0.000 | 0.000 | 0.000 | 0.000 | 0.000 | 0.000 | 0.000 | 0.000 | -0.079 | 0.000 |
| PCC | 0.000 | 0.000 | 0.000 | 0.000 | 0.000 | 0.000 | 0.028 | 0.000 | 0.000 | 0.022 |
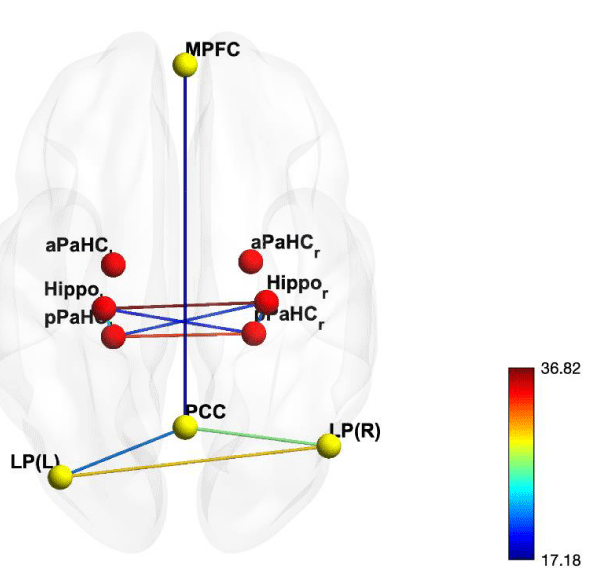
Figure 3: CONN toolbox ROI-to-ROI graphic model with 10 highest connections of resting-state fMRI connectivity with 10 seed area. Results are threshold at FDR-corrected p < 0.05.
Interpreting connectivity models
Hippocapus is known to play crucial role in both memory encoding [24], and memory recollection [25,26]. Considering our experiment paradigm where the subjects were presented with memory recollection stimuli during pre-resting-state fMRI phase, the hippocampus is likely to active during resting-state fMRI scan phase even without the subject consciously perform the recollection task, as the hippocampus performs memory consolidation and strengthening of the recalled memories in pre resting-state fMRI phase [27]. Moreover, there also is an evidence shows that left and right hippocampi responsible for different cognitive roles. The left hippocampus plays a critical role in episodic verbal memory while the right is more important for spatial memory processing [28]. This might indicate that the right hippocampus is processing projected spatial memory in recalled episodic memory, then pass the information to the left hippocampus for it to process the information into abstract concept to be consolidated and reinforced. Considering the between-subject contrast of this study, which is High-Confidence-Low-Difficulty-Low-Confidence-High-Difficulty, it is reasonable to see this effect.
While the unique contribution of posterior parahippocampal cortex is unclear, several study suggest that it contributes to memory function as patients with lesions involving the parahippocampal cortex are impaired on a memory task [29]. From the resulting effective connectivity of this study, it suggests that activity in right hippocampus cause activity in right posterior parahippocampal area. Several studies suggest that the parahippocampal cortex is functionally dissociable from the hippocampus [30-32]. However, the dissociation does not eliminate the possibility of information exchange between hippocampus and parahippocampal cortex as shown in an fMRI study of incidental target detection task, the parahippocampal cortex was active only for novel scenes while the hippocampus was selectively active to changes in the spatial relationship between objects and their background context [33]. In case of the result of this study, the connection from right hippocampus to posterior parahippocampal cortex may suggest that posterior parahippocampal cortex is encoding memory that it recognizes as novel from information formerly processed by hippocampus.
Posterior cingulate cortex and lateral parietal Default Mode network are known to involve episodic memory retrieval function [34,35]. While the functional relationship between these two network is unclear, there is a hypothesis stated that the posterior cingulate cortex is a central node in the default mode network of the brain [36,37]. There are evidences show increase in activity in the posterior cingulate cortex during episodic recollection [38], and mental time-travelling [39]. Some study also suggests that it regulates balance between internally and externally focused thought [40] as it is active both during task-related and rest cognitive state [41]. Since the evidences of specific role of posterior cingulate cortex default mode network in response to specific cognitive function are inconclusive, this particular connection may only reflect the intrinsic default mode network activity of the brain.
In summary, the group with higher episodic memory recollection performance has an active network in hippocampus and posterior parahippocampal area.
Within-region interaction and coherent connection may also contribute to the performance gain of the group, but it is outside the scope of this study.
Behavioral results
The behavioral profile of each subjects is determined by self-assessed memory recollection questionnaire. The subject was presented with 3-word combination stimuli consisted of descriptive time, place, and action. Then the subject was asked to recall memory related to the stimuli and determine the difficulty and the confidence of the recollections.
The subjects are divided into 2 groups by Euclidean distance clustering based on episodic memory recollection performance obtained using self-assessment test during post resting-state fMRI phase. The self-assessment test asked the subjects to determine their confidence in the correctness of their recollections and difficulty in recalling those memories. Both assessments were quantify from low too high in 1 to 5 integer scale. The clustering was done in 2-dimensional plane where each dimensions represents each aforementioned confidence and difficulty parameters. The values of each parameters for an individual subject are mean averages value of the test across all recollection stimuli. From the result of the clustering, the group with lower average confidence is considered a low-confidence group, and vice versa. Likewise, the group with lower average difficulty is considered low-difficulty group, and vice versa. Combining aforementioned 2 parameters, the groups can be categorized into 2 characteristic groups, high-confidence-low-difficulty group, and low-confidence-high-difficulty group, with 79 members and 41 members respectively (Figure 4 and Table 5). These categories were used as between-subject contrast for group resting-state connectivity analysis.
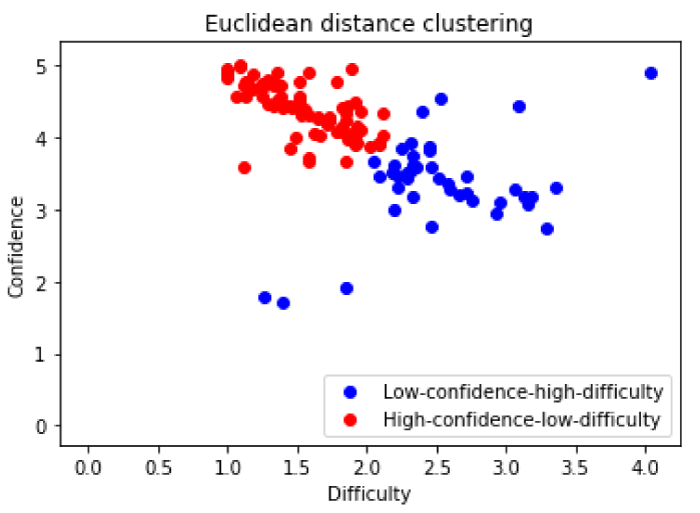
Figure 4: Euclidean distance clustering of episodic recollection performance. The group with lower average confidence is considered a low-confidence group, and vice versa. Likewise, the group with lower average difficulty is considered low-difficulty group, and vice versa.
| Table 5: Category of subject based-on self-assessment memory recollection test. | |
| Group | Number of subjects |
| High Confidence Low Difficulty (Red) | 79 |
| Low Confidence High Difficulty (Blue) | 41 |
Functional connectivity
After the standard fMRI data preprocessing protocol and additional temporal preprocessing in preparation for connectivity analysis by CONN toolbox and Tigramite framework, the BOLD signal of each regions of interest are extracted. The ROI BOLD signals are average BOLD time-series aggregated across all the voxel covered within the ROI. The 10 ROIs were selected for the analysis based on the background knowledge’s that those areas are known to involve in memory related cognitive function (Table 1). The purpose of including those areas in the connectivity model is to model how those areas interact with each other in relation to our cognitive function of interest. The roles and functions of each individual regions will be discussed in detail in the discussion section. The areas are defined using Harvard-Oxford Atlas. Then the CONN toolbox ROI-to-ROI connectivity analysis was performed on the aforementioned ROI BOLD data.
The resulting connectivities are shown in table 3 and the highest 10 connectivities are listed in table 2. CONN toolbox constructs a connectivity graph using seed-based approach by iteratively considers each ROIs as seed, then combines the results of every seeds (ROIs) into one single graph. This approach is acceptable for functional connectivity analysis since functional connectivity concern only correlation between seed and region-of-interest, the direction of the connection does not affect correlation measures. It can be observed in table 3 that swapping a specific pair of seed region and ROI does not yield different connectivity measure. This is completely different from effective connectivity which a pair of regions has different connection measure depends on the direction of the connections.
Table 2 shows consolidated highest 10 connections sorted by intensity. Figure 3 is a connectivity plot of the aforementioned consolidated connections (full connectivity plot is included in figure 5 in Supplementary materials section). The highest 3 connections are the hemisphere pairs of the identical regions. The most intense connectivity following those pairs is a connection between posterior cingulate cortex Default Mode network and right lateral parietal Default Mode network, followed by connections between hippocampus and anterior parahippocampal cortex on the left hemisphere, left lateral parietal Default Mode network and posterior parahippocampal cortex and hippocampus on the right hemisphere, left posterior parahippocampal cortex and right hippocampus, right posterior parahippocampal cortex and left hippocampus, and finally medial prefrontal cortex Default Mode network and posterior cingulate cortex Default Mode network.
Effective connectivity
The effective connectivity analysis was performed using the exact same data with the functional connectivity analysis in previous section. The exact same preprocessing protocol is performed on the data, so that any discrepancy in the resulting connectivity model is a result of capability of the analytic algorithms, since one of the goal in this study is to compare two models from different modal of analyses.
The resulting effective connectivity shows 7 connectivities among the selected ROI (Figure 2). Five out of 7 connections are interactions between two identical regions of difference hemisphere. The remaining 2 connections are connection from right hippocampus to right posterior parahippocampal cortex, and from posterior cingulate cortex Default Mode network to left lateral parietal Default Mode network. All connection weights (mutual conditional information measure), including auto mutual conditional information measure, is shown in table 4. Tigramite’s graphic model and time-series graph model are included in Supplementary material as figures 6,7 respectively.
In this work, we have constructed functional and effective connectivity models from the same resting-state fMRI BOLD data. By comparing these two models, we illustrated the practical advantages of effective connectivity over functional connectivity. The Tigramite framework used to derived effective model provides performance advantage in comparison to CONN toolbox by eliminating trivial connection from the connectivity model, in addition to connections’ directional information of the connectivity model. These advantages increase intepretability of the model. Currently, a large body of studies in brain connectivity focuses on only functional connectivity analysis. As the result of this study has shown, we would like to emphasize the limitation of functional connectivity analysis in terms of interpretability, and would like to encourage brain connectivity study with effective connectivity model as it improves interpretability of the actual brain function.
Nonetheless, the Tigramite framework is a novel framework and the application on fMRI BOLD data is scarce. Further study need to be done to confirm its validity on BOLD data application.
We would like to also emphasize the importance of BOLD data noise reduction, since these connectivity analysis frameworks are temporal sensitive and prone to generate spurious connection from BOLD signal noise. The preprocessing pipeline established in CONN toolbox is crucial to successful connectivity modeling in both case.
- Tulving E. What Is Episodic Memory? Current Directions in Psychological Science. 1993; 2: 67-70.
- Ullman MT. Contributions of memory circuits to language: the declarative/procedural model, Cognition. 2004; 92: 231-270. PubMed: https://www.ncbi.nlm.nih.gov/pubmed/15037131
- Rubinov M, Sporns O. Complex network measures of brain connectivity: uses and interpretations. NeuroImage. 2010; 52, 1059-1069. PubMed: https://www.ncbi.nlm.nih.gov/pubmed/19819337
- Friston KJ. Functional and effective connectivity in neuroimaging: A synthesis. Human Brain Mapping. 1994; 2: 56-78.
- Granger CWJ. Investigating Causal Relations by Econometric Models and Cross-spectral Methods. Econometrica. 1996; 37: 424.
- Pearl J. Causality: Models, Reasoning and Inference (Cambridge University Press, New York, NY, USA). 2009.
- Whitfield-Gabrieli S, Nieto-Castanon A. Conn: a functional connectivity toolbox for correlated and anticorrelated brain networks. Brain connectivity. 2012; 2: 125-141. PubMed: https://www.ncbi.nlm.nih.gov/pubmed/22642651
- Runge J. Quantifying information transfer and mediation along causal pathways in complex systems. Phys Rev E. 2015; 92: 062829. PubMed: https://www.ncbi.nlm.nih.gov/pubmed/26764766
- Runge J. Causal network reconstruction from time series: From theoretical assumptions to practical estimation. Chaos. 2018; 28: 075310. PubMed: https://www.ncbi.nlm.nih.gov/pubmed/30070533
- Margulies DS, Bottger J, Long X, Lv Y, Kelly C, et al. Resting developments: a review of fMRI post-processing methodologies for spontaneous brain activity. Magma. 2010; 23: 289-307. PubMed: https://www.ncbi.nlm.nih.gov/pubmed/20972883
- Duggento A, Passamonti L, Valenza G, Barbieri R, Guerrisi M, et al. Multivariate Granger causality unveils directed parietal to prefrontal cortex connectivity during task-free MRI. Sci Rep. 2018; 8: 5571. PubMed: https://www.ncbi.nlm.nih.gov/pubmed/29615790
- Corkin S, What's new with the amnesic patient H.M.? Nat Rev Neurosci. 2002; 3: 153-160. PubMed: https://www.ncbi.nlm.nih.gov/pubmed/11836523
- Henson RN, Rugg MD, Shallice T, Dolan RJ. Confidence in recognition memory for words: dissociating right prefrontal roles in episodic retrieval. J Cogn Neurosci. 2000; 12: 913-923. PubMed: https://www.ncbi.nlm.nih.gov/pubmed/11177413
- Runge J, Nowack P, Kretschmer M, Flaxman S, Sejdinovic D. Detecting causal associations in large nonlinear time series datasets. Sci Adv. 2019; 27; 5. PubMed: https://www.ncbi.nlm.nih.gov/pubmed/31807692
- Fox MD, Raichle M. Spontaneous fluctuations in brain activity observed with functional magnetic resonance imaging. Nat Rev Neurosci. 2007; 8: 700-711. PubMed: https://www.ncbi.nlm.nih.gov/pubmed/17704812
- Behzadi Y, Restom K, Liau J, Liu TT. A component based noise correction method (CompCor) for BOLD and perfusion based fMRI. NeuroImage. 2007; 37: 90-101. PubMed: https://www.ncbi.nlm.nih.gov/pubmed/17560126
- Laufs H, Krakow K, Sterzer P, Eger E, Beyerle A, et al. Electroencephalographic Signatures of Attentional and Cognitive Default Modes in Spontaneous Brain Activity Fluctuations at Rest. Proc Natl Acad Sci U S A. 2003; 100: 11053-11058. PubMed: https://www.ncbi.nlm.nih.gov/pubmed/12958209
- Fox M, Snyder AZ, Vincent JL, Corbetta M, Van Essen DC, et al. The Human Brain Is Intrinsically Organized into Dynamic, Anticorrelated Functional Networks. Proc Natl Acad Sci U S A. 2005; 102: 9673-9678. PubMed: https://www.ncbi.nlm.nih.gov/pubmed/15976020
- Greicius MD, Krasnow B, Reiss AL, Menon V. Functional Connectivity in the Resting Brain: A Network Analysis of the Default Mode Hypothesis. Proc Natl Acad Sci U S A. 2003; 100: 253-258. PubMed: https://www.ncbi.nlm.nih.gov/pubmed/12506194
- Fransson P. Spontaneous low-frequency BOLD signal fluctuations: An fMRI investigation of the resting-state default mode of brain function hypothesis. Hum Brain Mapp. 2005; 26: 15-29. PubMed: https://www.ncbi.nlm.nih.gov/pubmed/15852468
- Vincent JL, Snyder AZ, Fox MD, Shannon BJ, Andrews JR. Coherent Spontaneous Activity Identifies a Hippocampal-Parietal Memory Network. J Neurophysio. 2006; 96: 3517-3531. PubMed: https://www.ncbi.nlm.nih.gov/pubmed/16899645
- Rombouts SARB, Stam CJ, Kuijer JPA, Scheltens P, Barkhof F. Identifying confounds to increase specificity during a "no task condition". NeuroImage. 2003; 20: 1236-1245. PubMed: https://www.ncbi.nlm.nih.gov/pubmed/14568492
- Horwitz B. The elusive concept of brain connectivity. NeuroImage. 2003; 19: 466-470.
- O'Kane G, Kensinger EA, Corkin S. Evidence for semantic learning in profound amnesia: An investigation with patient H.M. Hippocampus. 2004; 14; 417-425. PubMed: https://www.ncbi.nlm.nih.gov/pubmed/15224979
- Lehn H, Steffenach HA, van Strien NM, Veltman DJ, Witter MP. A specific role of the human hippocampus in recall of temporal sequences. The J Neurosci. 2009; 29: 3475-3484. PubMed: https://www.ncbi.nlm.nih.gov/pubmed/19295153
- Merkow MB, Burke JF, Kahana MJ. The human hippocampus contributes to both the recollection and familiarity components of recognition memory. Proc Natl Acad Sci U S A. 2015; 112: 14378-14383. PubMed: https://www.ncbi.nlm.nih.gov/pubmed/26578784
- Harand C, Bertran F, La Joie R, Landeau B. The Hippocampus Remains Activated over the Long Term for the Retrieval of Truly Episodic Memories. PloS one. 2012; 7: e43495). PubMed: https://www.ncbi.nlm.nih.gov/pubmed/22937055
- Ezzati A, Katz MJ, Zammit AR, Lipton ML. Zimmerman ME, et al. Differential association of left and right hippocampal volumes with verbal episodic and spatial memory in older adults. Neuropsychologia. 2016; 93: 380-385. PubMed: https://www.ncbi.nlm.nih.gov/pubmed/27542320
- Van Hoesen GW. The parahippocampal gyrus: New observations regarding its cortical connections in the monkey. Trends in Neurosciences. 1982; 5: 345-350.
- Bohbot VD, Allen JJB, Dagher A, Dumoulin SO, Evans AC, et al. Role of the parahippocampal cortex in memory for the configuration but not the identity of objects: converging evidence from patients with selective thermal lesions and fMRI. Frontiers in human neuroscience. 2015; 9: 431. PubMed: https://www.ncbi.nlm.nih.gov/pubmed/26283949
- Kohler S, Danckert S, Gati JS, Menon RS. Novelty responses to relational and non-relational information in the hippocampus and the parahippocampal region: A comparison based on event-related fMRI. Hippocampus. 2005; 15: 763-774. PubMed: https://www.ncbi.nlm.nih.gov/pubmed/15999342
- WIttmann BC, Bunzeck N, Dolan RJ, Du E. Anticipation of novelty recruits reward system and hippocampus while promoting recollection. NeuroImage. 2007; 38: 194-202. PubMed: https://www.ncbi.nlm.nih.gov/pubmed/17764976
- Howard LR, Kumaran D, Olafsdottir HF, Spiers HJ. Double Dissociation between Hippocampal and Parahippocampal Responses to Object-Background Context and Scene Novelty. J Neurosci. 2011; 31: 5253-5261. PubMed: https://www.ncbi.nlm.nih.gov/pubmed/21471360
- Nielsen FA, Balslev D, Hansen LK. Mining the posterior cingulate: Segregation between memory and pain components. NeuroImage. 2005; 27: 520-532. PubMed: https://www.ncbi.nlm.nih.gov/pubmed/15946864
- Sestieri C, Corbetta M, Romani GL, Shulman GL. Episodic Memory Retrieval, Parietal Cortex, and the Default Mode Network: Functional and Topographic Analyses. J Neurosci. 2011; 31: 4407-4420. PubMed: https://www.ncbi.nlm.nih.gov/pubmed/21430142
- Raichle ME, MacLeod AM, Snyder AZ, Powers WJ, Gusnard DA, et al. A default mode of brain function. Proceedings of the National Academy of Sciences. 2001; 98: 676-682.
- Buckner RL, Andrews-Hanna JR, Schacter DL. The brain's default network. Annals of the New York Academy of Sciences. 1124; 1-38.
- Gusnard DA, Akbudak E, Shulman GL, Raichle ME. Medial prefrontal cortex and self-referential mental activity: relation to a default mode of brain function. Proc Natl Acad Sci U S A. 2001; 98: 4259-4264. PubMed: https://www.ncbi.nlm.nih.gov/pubmed/11259662
- Addis DR, Wong AT, Schacter DL. Remembering the past and imagining the future: Common and distinct neural substrates during event construction and elaboration. Neuropsychologia. 2007; 45: 1363-1377. PubMed: https://www.ncbi.nlm.nih.gov/pubmed/17126370
- Leech R, Kamourieh S, Beckmann CF, Sharp DJ. Fractionating the Default Mode Network: Distinct Contributions of the Ventral and Dorsal Posterior Cingulate Cortex to Cognitive Control. J Neurosci. 2011; 31: 3217-3224. PubMed: https://www.ncbi.nlm.nih.gov/pubmed/21368033
- Mason MF, Norton MI, Van Horn JD, Wegner DM, Grafton ST, et al. Wandering Minds: The Default Network and Stimulus-Independent Thought. Science. 2007; 315: 393-395. PubMed: https://www.ncbi.nlm.nih.gov/pubmed/17234951