
More Information
Submitted: 26 June 2020 | Approved: 10 August 2020 | Published: 11 August 2020
How to cite this article: Bugeme M, Mukuku O, Diop-Sène MS, Massi DG, Seck LB. Visual evoked potentials: Normative values from healthy Senegalese adults. J Neurosci Neurol Disord. 2020; 4: 049-052.
DOI: 10.29328/journal.jnnd.1001034
Copyright License: © 2020 Bugeme M, et al. This is an open access article distributed under the Creative Commons Attribution License, which permits unrestricted use, distribution, and reproduction in any medium, provided the original work is properly cited.
Keywords: Visual evoked potentials; Normative values; Dakar

Visual evoked potentials: Normative values from healthy Senegalese adults
Marcellin Bugeme1, Olivier Mukuku2*, Marième Soda Diop-Sène3, Daniel Gams Massi3 and Lala Bouna Seck3
1Faculté de Médecine, Université de Lubumbashi, République Démocratique du Congo
2Institut Supérieur des Techniques Médicales, Lubumbashi, République Démocratique du Congo
3Neurological Clinic of the National Teaching Hospital, Université Cheik Anta Diop, Dakar, Senegal
*Address for Correspondence: Olivier Mukuku, Institut Supérieur des Techniques Médicales, Lubumbashi, République Démocratique du Congo, Tel: +243 997 925 649; Email: [email protected]
Introduction: Visual evoked potentials (VEPs) are potential differences recorded on the scalp in response to visual stimulation. They are obtained with slowly repeated stimuli. The aim of this study was to determine the normative values of the visual evoked potentials in our setting.
Methodology: We conducted a cross-sectional study from February 1 to April 30, 2019 at the Clinical Neurophysiology laboratory of the I.P. Ndiaye Clinic at CHNU Fann in Dakar (Senegal).
Results: We found that men had high averages of N75, P100 and N145 wave latencies and low averages of P100 wave amplitude (p>0.05). However, neither age nor body mass index influenced the parameters of VEPs.
Conclusion: Sex is important physiological variable in establishing laboratory normative values for VEPs. There is a marked difference between the sexes for the VEPs parameters.
Cortical Visual Evoked Potentials (VEPs) are the functional tests of the macular pathways, from the macular areas to the primary visual areas. They result from the amplification of signals from the photopic system located over the entire macular surface (flash VEP) or in different macular sectors (checkered VEP) and their conduction along the visual pathways [1]. The VEPs are used to test the functioning of the photopic system located in the macular areas, if the results of the visual assessments suggest a normal functioning of the visual pathways. In addition, they can be used to assess the signal conduction along the visual pathways [2].
VEP is a very important noninvasive tool in detecting abnormalities of visual system. It is not only useful for clinical neurophysiologist or ophthalmologist but also for neurologists and neurosurgeons, since many of the neurological disorders present with visual abnormalities. VEP can be affected by various physiological (age, sex, pupil size and visual acuity) and technical (check size, luminance, field size, etc.) factors [3].
Values of VEPs in normal subjects should be available in the clinical neurophysiology laboratory to determine whether the results of a given subject are normal or not. It should be noted that the normative values of VEPs vary from one laboratory to another and it is therefore recommended that each laboratory preferably has its own normative data [1]. Studies on normal subjects are needed in each population to determine the normative values for the VEPs and the factors affecting it.
This study aims to determine the normative values and to investigate the effect of age, sex and anthropometric parameters on visual evoked potentials.
This is a cross-sectional study which was carried out at the clinical neurophysiology laboratory of the Ibrahima Pierre Neuroscience Clinic of Fann national teaching hospital in Dakar (Senegal) from February 1st to April 30th, 2019. The present study was carried out on Senegalese subjects who agreed to participate in the study and who did not have any visual disorder. All subjects had an ophthalmological examination including an assessment of visual acuity with Snellen’s charts and a fundus examination to exclude any visual disorder. We excluded from the study subjects using mydriatric/meiotic drops, subjects with ophthalmological problems (visual acuity < 7/10, glaucoma, cataract, retinopathy, optic atrophy), subjects taking drugs which may affect normal functioning central nervous system (opioids, antipsychotics, antidepressants, sedatives, etc.), subjects with a history of CNS disease (meningitis, stroke, multiple sclerosis, Parkinsonism, etc.). We performed VEPs on aged-matched 20 men and 20 women.
VEP monitor displaying a checkerboard alternating with homogeneous light field was used in our study. We recorded the following parameters: age, sex, height, weight, and body mass index (BMI). VEP parameters recorded were the latencies (in ms) of the N75, P100 and N145 waves and the amplitude (in µv) of the P100 wave.
The recording was done in a dark room with quiet surroundings and the VEPs were recorded on a Teca Synergy EMG System device (EMG & Evoked Potential Response Unit, model Synergy, Manufacturer by Teca). A one channel montage was used to record the VEP. We used the needle electrodes placed subcutaneously. At the scalp, the electrodes were placed relative to bony landmarks according to the International 10/20 system [4]. The active electrode was placed at Oz (highest point of the occiput), the reference electrode was placed at Cz (vertex) and the mass electrode was placed on the forearm subcutaneously.
Visual stimulation was performed by an alternating checkerboard (from black to white and from white to black) at a fixed rate of two reversals per second. The subject was seated at a fixed distance of 100 cm from the screen and was asked to settle in the center of the screen (Figure 1). Monocular full field stimulation was administered to both eyes separately. A sweep length of 250 ms was performed and 100 responses were averaged. The waveform was recorded twice to ensure reproducibility and the electrode impedance was kept less than 5 KΩ.
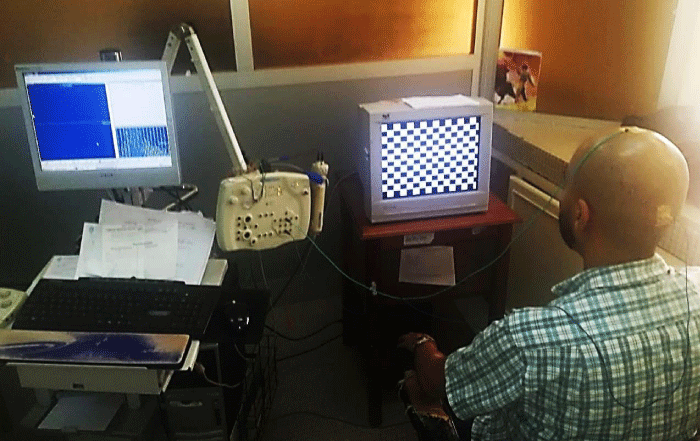
Figure 1: Image showing a subject in a VEP recording session in the clinical neurophysiology laboratory of the Ibrahima Pierre Neuroscience Clinic of Fann national teaching hospital in Dakar (Senegal). Legend: The recording was done in a dark room with quiet surroundings. The subcutaneous needle electrodes were placed on the scalp: the active electrode placed in Oz and the reference electrode in Cz (according to the International 10/20 system); the mass electrode placed on the forearm. Visual stimulation was performed by an alternating checkerboard (from black to white and from white to black) at a fixed rate of two reversals per second.
Data analysis was carried out by EPI-INFO version 7.2. Alpha was be set at level of 5%, and all statistical tests reported were two-tailed (with normal distribution) using Student’s t-test for comparisons of means between groups regarding sex (male vs. female), age groups (< 40 years vs. ≥ 40 years) and BMI groups BMI (≤ 24.9 kg/m2 vs. > 24.9 kg/m2).
Ethics statement
The approval to conduct the study and authorizations were obtained from the Medical Ethic Committee of the University of Cheikh Anta Diop. Data was used with high confidentiality and no names were recorded.
We carried out the VEPs in 20 men and 20 women. The mean age was 34.6 ± 8.8 years (range: 18 and 50 years); the median age was 38 years; it was 35.9 ± 8.2 years for men and 33.4 ± 9.4 for women (Table 1).
| Table 1: Comparison of age and anthropometric parameters between female and male subjects. | ||||
| Variable | Total (n = 40) |
Male (n = 20) |
Female (n = 20) |
p - value* |
| Mean ± SD | Mean ± SD | Mean ± SD | ||
| Age (years) | 34.6 ± 8.8 | 35.9 ± 8.2 | 33.4 ± 9.3 | 0.365 |
| Weight (kg) | 71.9 ± 10.5 | 76.7 ± 9.5 | 67.2 ± 9.6 | 0.003 |
| Height (cm) | 172.6 ± 8.3 | 176.8 ± 8.3 | 168.4 ± 6.1 | 0.0007 |
| BMI (kg/m²) | 24.6 ± 3.2 | 24.6 ± 3.2 | 23.7 ± 3.4 | 0.425 |
| *p - value from sex comparison. | ||||
Table 2 shows comparisons of VEP values between men and women (right eye and left eye). Regardless of the eye and the value of VEP considered, statistical analyzes show significant differences between men and women. The mean latencies of the N75, P100 and N145 waves are statistically higher in men than in women (p < 0.05). In contrast, the amplitude of the P100 wave was higher in women than in men in both eyes (p < 0.01).
| Table 2: Comparison of VEP parameters between female and male subjects in right and left eyes. | ||||||||||
| Variable | Right eye | Left eye | ||||||||
| Male (n = 20) | Female (n = 20) | p - value* | Male (n = 20) | Female (n = 20) | p - value* | |||||
| Mean ± SD | (Min – Max) | Mean ± SD | (Min-Max) | Mean ± SD | (Min-Max) | Mean ± SD | (Min-Max) | |||
| N75 Latency (ms) | 73.4 ± 5.4 | (59.6 – 84.8) | 69.0 ± 5.9 | (54.3 – 83.0) | 0.008 | 73.1 ± 4.7 | (61.9 – 91.7) | 69.2±4.7 | (56.3 – 75.5) | 0.011 |
| P100 Latency (ms) | 100.9 ± 4.1 | (93.8 – 108.1) | 96.4 ± 7.0 | (73.8 – 107.6) | 0.012 | 100.0 ± 4.6 | (91.7 – 110.2) | 96.4±6.6 | (75.5 – 106.6) | 0.046 |
| N145 Latency (ms) | 146.2 ± 8.1 | (130.4 – 158.4) | 133.3 ± 12.3 | (98.7 – 146.6) | 0.000 | 143.9 ± 8.7 | (122.0 – 155.3) | 134.5±11.2 | (102.2 – 149.1) | 0.003 |
| P100 Amplitude (µv) | 5.6 ± 1.9 | (3.2 – 10.6) | 11.1 ± 7.4 | (3.8 – 9.1) | 0.002 | 6.0 ± 2.5 | (2.8 – 10.6) | 9.8±3.4 | (5.1 – 16.3) | 0.001 |
| *p - value from sex comparison. | ||||||||||
When comparing the values of VEP between people < 40 years old and those ≥ 40 years old, the statistical analysis does not show any significant difference (p > 0.05), whatever the value of the VEP considered (Table 3).
| Table 3: Comparison of VEP parameters between age groups in right and left eyes. | ||||||||||
| Variable | Right eye | Left eye | ||||||||
| < 40 years (n = 20) | ≥ 40 years (n = 20) | p- value* | < 40 years (n =20) | ≥ 40 years (n = 20) | p - value* | |||||
| Mean ± SD | (Min – Max) | Mean ± SD | (Min-Max) | Mean ± SD | (Min-Max) | Mean ± SD | (Min-Max) | |||
| N75 Latency (ms) | 70.3 ± 3.3 | (65.0 – 74.8) | 72.0 ± 7.8 | (54.3 – 84.7) | 0.129 | 70.5 ± 3.1 | (66.3 – 77.4) | 71.8 ± 6.5 | (77.4 – 80.3) | 0.171 |
| P100 Latency (ms) | 98.0 ± 4.8 | (88.7 – 107.6) | 99.3 ± 7.3 | (73.8 – 108.1) | 0.244 | 97.9 ± 4.7 | (90.8 – 106.6) | 98.4 ± 6.9 | (75.5 – 110.2) | 0.386 |
| N145 Latency (ms) | 143.1 ± 8.9 | (127.6 – 158.4) | 136.4 ± 14.2 | (98.7 – 154.7) | 0.176 | 141.1 ± 9.2 | (122.0 – 155.3) | 137.3 ± 12.5 | (102.2 – 154.7) | 0.524 |
| P100 Amplitude (µv) | 8.9 ± 7.6 | (3.2 – 3.9) | 7.8 ± 4.0 | (3.3 – 16.9) | 0.714 | 7.6 ± 2.9 | (3.0 – 13.2) | 8.2 ± 4.1 | (2.9 – 16.3) | 0.892 |
| *p - value from age groups comparison. | ||||||||||
No difference was also found between subjects with normal BMI (≤ 24.9 kg/m2) and those with high BMI (> 24.9 kg/m2) (p > 0.05) regarding the values of VEP (Table 4).
| Table 4: Comparison of VEP parameters between subjects with normal and high Body Mass Index in right and left eyes. | ||||||||||
| Variable | Right eye | Left eye | ||||||||
| ≤ 24.9 kg/m2 (n = 25) | 24.9 kg/m2 (n = 15) | p - value* | ≤ 24.9 kg/m2 (n = 25) | >24.9 kg/m2 (n = 15) | p - value* | |||||
| Mean ± SD | (Min – Max) | Mean ± SD | (Min-Max) | Mean ± SD | (Min-Max) | Mean ± SD | (Min-Max) | |||
| N75 Latency (ms) | 70.4 ± 6.5 | (54.3 – 84.8) | 72.3±5.2 | (60.6 – 78.6) | 0.159 | 70.0±5.1 | (56.3 – 78.0) | 72.9±4.6 | (64.6 – 93.6) | 0.077 |
| P100 Latency (ms) | 97.7 ± 6.6 | (73.8 – 106.4) | 100.1±5.1 | (93.8 – 108.1) | 0.534 | 97.2±6.4 | (75.5 – 101.1) | 99.6±4.8 | (93.6 – 110.2) | 0.293 |
| N145 Latency (ms) | 140.6 ± 13.1 | (98.7 – 158.4) | 138.5±10.9 | (120.6 – 154.2) | 0.464 | 139.5±12.4 | (102.2 – 155.3) | 138.8±8.8 | (127.0 – 154.7) | 0.507 |
| P100 Amplitude (µv) | 6.8 ± 2.8 | (3.2 – 13.2) | 10.7±8.5 | (4.8 – 12.0) | 0.094 | 7.5±3.0 | (3.0 – 14.0) | 8.5±4.2 | (2.8 – 16.3) | 0.648 |
| *p - value from comparison of normal and high BMI | ||||||||||
VEP exam is an important procedure to assess visual function and is very sensitive to assess lesions of the optic nerve and the optic chiasm [1]. Activation of the visual cortex occurs mainly through the central visual field. VEP can be altered if there is an abnormality in any level of the visual pathway including the eye, retina, optic nerve, optical radiation and the occipital cortex [5]. The study we conducted focused on subjects with an average age of 34.5 ± 9.5 years with 50% of female. Several other studies have been carried out in young subjects with an equal proportion of sex [3,6]. This is to account for the variation in responses related to sex and age. In our series, compared to women, we found that men had high averages of N75, P100 and N145 wave latencies and low averages of P100 wave amplitude. The latency of peak amplitude and the peak amplitude are clearly inter-related. Our results corroborate those of Sharma et al. [3] who found statistically higher latencies N75, P100 and N145 in men compared to women. P100 amplitude was higher in women than in men. This was also considered statistically significant both on the left and on the right. This finding is similar to that of several other studies [7-11]. The explanation for this difference in values between men and women is not clear [4]. This assertion was contested by other authors who did not find any significant difference in both sexes regarding the VEP latencies [6,12,13]. The sex difference may be due to anatomical or endocrine differences between the two sexes. Kaneda, et al. [14] postulated that the sex differences in VEP may be attributed to genetically determined sex differences in neuro-endocrinological systems. In short, sex differences in the human visual system, although controversial, are undeniable [15]. Additional investigation of sex differences in the human visual system would contribute to confirm that. It should be noted that individual differences in the amplitude and latencies of the VEP might be due to background electroencephalogram (EEG). The VEP tends to be synchronized to the background alpha rhythm. It would be useful in future to examine the power spectrum of resting state EEG to see if its might account for the sex difference. In addition the degree of maintained alertness an orienting can influence these components.
The mean latencies of N75 and P100 waves were slightly decreased in subjects < 40 years of age compared to those of subjects ≥40 years of age with the right eye and the left eye in this study. The decrease in amplitude and the increase in latency of the P100 wave were observed in our participants’ ≥ 40 years old; but with no statistically significant difference observed. A study carried out in Fez (in Morocco) by El Machkour found a progressive decrease in amplitude and an increase in latencies in subjects 40 years or older and the difference was not considered statistically significant [16]. Similar results were found in other studies including those of Sawaya, et al. [8] and Van Orden, et al. [17]. In contrast, in the series by Snyder, et al. [10], this difference was statistically significant (vs. < 0.05). The literature review shows that latencies generally decrease during maturation, stabilize at the beginning of adulthood, and then begin to increase sometime after the end of the twenties [18,19]. The absence of significance of these results in our study could possibly be linked to the reduced sample size.
Analysis of the relationship between BMI and VEP latencies did not show any significant association. Gupta, et al. [12] reported also no statistically significant correlation between the BMI and VEP latencies. Sharma, et al. [3] found a significant correlation only for N145 latency in relation to the female BMI.
This study shows that the sex is an important physiological variable in establishing laboratory normative values for VEP. There is a statistically significant difference between the sexes for the values of VEP, women with shorter latencies and higher amplitudes. The normative values of VEP vary from one clinical neurophysiology laboratory to another. Each laboratory performing VEP studies should have its own standards for future interpretations, as the interpretation of test results is done according to the standards.
- Holder GE. The effects of chiasmal compression on the pattern visual evoked potential. Electroencephalography and clinical neurophysiology. 1978; 45: 278-28.
- Gupta S, Gupta G, Deshpande VK. Visual evoked potentials: Impact of age, gender, head size and BMI. Int. J. Biomed. Adv. Res. 2016; 7: 22-26.
- Tandon OP, Ram D. Visual evoked responses to pattern reversal in children. Indian J Physiol Pharmacol. 1991; 35: 175-179.
- Kaneda Y, Nakayama H, Kagawa K, Furuta N, Ikuta T. Sex differences in visual evoked potential and electroencephalogram of healthy adults. Tokushima J Exp Med. 1996; 43: 143–157. PubMed: https://pubmed.ncbi.nlm.nih.gov/9100463/
- Vanston JE, Strother L. Sex differences in the human visual system. J Neurosci Res. 2017; 95: 617-625. PubMed: https://pubmed.ncbi.nlm.nih.gov/27870438/
- El Machkour M. Mise en place et élaboration des valeurs normales des potentiels évoqués visuels au laboratoire de neurophysiologie clinique du service de neurologie CHU Hassan II à Fès Université Sidi Mohammed Ben Abdellah. Faculté de Médecine et de Pharmacie. Thèse, Fès, Maroc. 2011.
- Van Orden KF, Sturr JF. Age-related amplitude changes of the pattern reversal evoked potential depend on stimulus spatial frequency and contrast (No. NMRI-90-104). Naval medical research inst bethesda md.1990.
- Emmerson-Hanover R, Shearer DE, Creel DJ, Dustman RE. Pattern reversal evoked potentials: gender differences and age-related changes in amplitude and latency. Electroencephalography and Clinical Neurophysiology/Evoked Potentials Section. 1994; 92: 93-101. PubMed: https://pubmed.ncbi.nlm.nih.gov/7511515/
- Onofrj M, Thomas A, Iacono D, DˈAndreamatteo G, Paci C. Age-related changes of evoked potentials. Neurophysiologie Clinique/Clinical Neurophysiology. 2001; 31: 83-10.