
More Information
Submitted: October 16, 2023 | Approved: October 27, 2023 | Published: October 30, 2023
How to cite this article: Pavlenko VD, Shamanina TV, Chori VV. Application of Nonlinear Dynamic Models of the Oculo-Motor System in Diagnostic Studies in Neurosciences. J Neurosci Neurol Disord. 2023; 7: 126-133.
DOI: 10.29328/journal.jnnd.1001086
Copyright License: © 2023 Pavlenko VD, et al. This is an open access article distributed under the Creative Commons Attribution License, which permits unrestricted use, distribution, and reproduction in any medium, provided the original work is properly cited.
Keywords: Psychophysiological states; Oculomotor system; Eye-tracking technology; Nonlinear dynamic identification; Volterra model; Multidimensional transient functions

Application of Nonlinear Dynamic Models of the Oculo-Motor System in Diagnostic Studies in Neurosciences
Vitaliy D Pavlenko* , Tetiana V Shamanina and Vladyslav V Chori
Odessa Polytechnic National University, Shevchenko av. 1, Odessa, 65044, Ukraine
*Address for Correspondence: Vitaliy D Pavlenko, Odessa Polytechnic National University, Shevchenko av. 1, Odessa, 65044, Ukraine, Email: [email protected]
The purpose of this work is to implement methods and develop tools for nonlinear dynamic identification of the Oculomotor System (OMS) “input-output” in the form of Multidimensional Transient Functions (MTF) based on eye tracking data and their use in an information system for diagnosing the psychophysiological state of a person. The object of the study is the process of diagnosing the psychophysiological state of an individual based on innovative eye-tracking technology. The subject of the research is computational algorithms and software for determining diagnostic features based on identification data of compulsory medical insurance in the form of MTF, constructing a Bayesian classifier using machine learning in the established space of the most informative features. A methodology has been developed and implemented for the experimental study of human compulsory mental health using innovative eye-tracking technology to record compulsory mental health responses to test visual stimuli. The obtained empirical data from input-output studies are used for the identification of OMS based on Volterra polynomials. Experimental studies of compulsory medical insurance of respondents were carried out before and after the working day. Based on the data obtained using the Tobii Pro TX300 eye tracker, the transient functions of the first, second, and third orders of the OMS were determined. Variability of second and third order transient functions was revealed for different psychophysiological states of the respondent (normal or fatigue). Thus, it seems appropriate to use MTF in diagnostic studies in the fields of neuroscience and psychology. Information technology for diagnosing human psychophysiological conditions has been further developed through the use of compulsory health insurance information models based on Volterra polynomials as a source of primary data. This allows for an increase in the accuracy of OMS modeling and, consequently, enhances the reliability of diagnosis within the framework of the proposed heuristic features. A set of heuristic features is proposed, which are determined using integral and differential transformations of the MTF OMS. The information content of individual features and all possible combinations of them in pairs was studied using the Probability of Correct Recognition (PCR) indicator. Two-dimensional feature spaces with the maximum PCR value (0.938) were identified during the diagnosis of a person’s psychophysiological state.
Military operations and natural disasters occurring today have a great impact on the psychophysiological state of a person. A significant number of people receive psychological trauma of varying degrees, which often leads to Post-Traumatic Stress Disorder (PTSD) and require constant psychological support and assistance. Because PTSD is a complex disorder that manifests itself simultaneously on psychological, biological, and social levels, treatment, depending on its depth, includes psychotherapy and sometimes the use of psychopharmacological drugs. The OMS model proposed by us allows us to determine the presence of PTSD syndrome, as well as to obtain a quantitative assessment of the depth of PTSD and, based on these studies, to choose the most effective treatment tactics. Modern PTSD care protocols recommend two psychotherapeutic methods: Cognitive Behavioral Therapy (CBT) and Eye Movement Desensitization and Reprocessing (EMDR). That is why it is important to diagnose the psychophysical condition of the person.
Studies of human eye movements and the trajectory of their movement allow us to reveal the structure of the individual’s relationship with the environment [1,2]. Analysis of the relationship between the oculomotor and the central nervous system, with the content of mental processes, with various forms of activity (behavior, activity, communication), contributes to the study of the mechanisms of brain work and their disorders, the identification of the dynamics of psychophysiological states of a person, patterns of perception, thinking, ideas, differentiation personal intentions [3,4].
In recent years, the high-tech innovation of eye-tracking has received further development and effective application in the construction of a mathematical model of the process of continuous eye movement tracking in order to detect anomalies in the tracking data for the quantitative assessment of motor symptoms of Parkinson’s disease [5,6]. At the same time, nonlinear dynamic models of Wiener and Volterra-Laguerre [7] are used, and the identification of the Oculomotor System (OMS) is based on the use of test random effects, which requires the use of correlation analysis methods and obtaining a large amount of experimental data (long duration of experimental studies).
To build the Volterra model of the human OMS, deterministic test effects can be used, for example, step signals (most suitable for studying the dynamics of OMS) [8,9], which will simplify the computational identification algorithm and significantly reduce the time of experimental data processing [10,11].
In work [12] a method of deterministic identification of OMS in the form of Multidimensional Transient Functions (MTF) using step test signals was developed, similar to the compensatory method of identification of nonlinear dynamic systems using impulse test signals [13]. Although the method requires a minimum number of test signals to identify OMS, its accuracy is insufficient for constructing Volterra models of more than second order, which hinders its practical application.
The advantages of deterministic methods in comparison with methods of statistical identification are the comparative ease of processing experimental data and implementing test signals. However, the results of deterministic identification are significantly affected by measurement errors [14]. The obtained estimates of the transient characteristics are unstable to the measurement errors of the OMS responses, which limits the application of the methods in the conditions of a real experiment.
The analysis of literary sources showed that, at the moment, no effective methods of building OMS models based on the Volterra polynomial based on experimental data obtained by eye-tracking have been developed. There is no proper instrumental, algorithmic, and software tools to support methods of identification of OMS using eye-tracking technology.
There is a need to increase the accuracy and computational stability of the assessment of multidimensional transient functions of OMS, to develop hardware and software tools for controlling the identification process, as well as to create information technology and intelligent computing systems for classification in the space of features determined by the results of OMS identification based on eye-tracking data.
The purpose of this work is to implement methods and means of nonlinear dynamic identification “input-output” of the OMS based on eye-tracking data based on Volterra models in the form of multidimensional transient functions and their application in information systems for diagnosing the psychophysiological state of a person, which expand the diagnostic capabilities of tools state assessment information technology.
OMS identification of OMS based on the discrete Volterra polynomial
The “input-output” ratio for a nonlinear dynamic system with an unknown structure (like a “black box”) with one input and one output can be represented by a discrete cubic Volterra polynomial in the form [15]:
(1)
Where w1[k1], w2[k1,k2], w3[k1,k2,k3] are discrete weight functions (Volterra kernels) of the 1st, 2nd, and 3rd orders; х[m], y[m] are input (stimulus) and output (response) function (signals) of the system, respectively; yn[m] is partial components of the response (convolution of n-th order sequences wn[k1,…,kn] and х[m]); m is a discrete time variable.
(2)
Multi-step test signals with different amplitudes aj (j = 1,2,…,L; L is the number of experiments, L ≥ N) xj(t) = ajθ(t) are used for identification [16]. The responses of the OMS, which are measured at the same time, will be denoted as y1[m], y2[m],…, yL[m]. If we determine the partial response components of the model , , then this will lead to the estimation of the transient functions of the first order and the diagonal intersections of the transient functions , (2).
The responses of the Volterra polynomial model are equal
, i = 1, 2, …, L; N = 1, 2, 3. (3)
To determine the transient functions , the Method of Least Squares (LSM) [16] is used, which provides a minimum of the root mean square error of the deviation of the model responses from the OMS responses to the same stimulus:
(4)
The minimization of criterion (4) is reduced to the solution of the system of normal Gaussian equations, which in vector-matrix form can be written as
, (5)
Where
.
After solving the system of equations (5) with respect to , we obtain estimates of the multidimensional transient functions в of the OMS at each moment of time m in the observation interval. From equation (5), we get
. (6)
After performing the matrix operations in (6), we get
(7)
Thus, for the model based on the cubic Volterra polynomial for N = 3 (1), we can estimate the transient functions of the first , second , and third orders (7).
Similarly, we obtain the formulas for evaluating the first-order transient functions – at N = 1; of the first and second orders , – at N = 2:
(8)
. (9)
The system of normal Gaussian equations (6) gives good results for the approximation of functions if the number of measurements L is large enough (much greater than the degree of the approximating polynomial N) or the measurement errors are small. Otherwise, the determinant of the system turns out to be close to zero, and the system becomes indeterminate. In this case, large errors in the estimation of the parameters of the approximating polynomial are possible. To obtain a solution of SLAE (6) resistant to measurement errors, the regularization method of A.N. Tikhonov is used [17,18].
The Tikhonov regularization method is based on the variational method of constructing the regularizing operator. It is used to obtain a measurement error-tolerant solution for a system of linear algebraic equations (5). This method boils down to finding an approximate solution vector that minimizes a certain smoothing functional. The only vector satisfying the minimum condition of the smoothing functional can be determined from the solution of the system of linear algebraic equations:
, (10)
Where A′ is the transposed matrix; I is the identity matrix; α is the Tikhonov regularization parameter.
When implementing this algorithm, the regularization parameter α is chosen sufficiently small from the analysis of the available information about the error of the initial data and the calculation error. In the work, the appropriate value of the regularization parameter α is determined by selection, i.e. repeated calculations , for different values of α. The quasi-optimal value of the parameter α = α0 is selected from the condition
, (11)
Where . It should be noted that different ways of determining the regularization parameter can give different results and, as a consequence, different regularized solutions.
Experimental studies of OMS using eye-tracking and calculation of the MTF
With the help of the developed software, a study of the psychophysiological states of a person was carried out. The experiments were organized in order to classify the subjects (informants) according to their state of fatigue.
Data for building OMS models – OMS responses to the same test visual stimuli with different distances хj (j = 1, 2, 3) from the starting position, which formally corresponds to test signals with amplitudes a1, a2 and a3, obtained using the Tobii Pro TX300 eye tracker at different times of the day: “In the Morning” (before work) and “In the Evening” (after work) and on different days. One complete cycle of OMS research for one respondent consists of 3 experiments at different amplitudes of test signals a1, a2, and a3 for the “In the Morning” state and for the “In the Evening” state. The graphs of OMS responses received for “In the Morning” and “In the Evening” were brought to the common beginning (starting point) and shown in Figure 1.
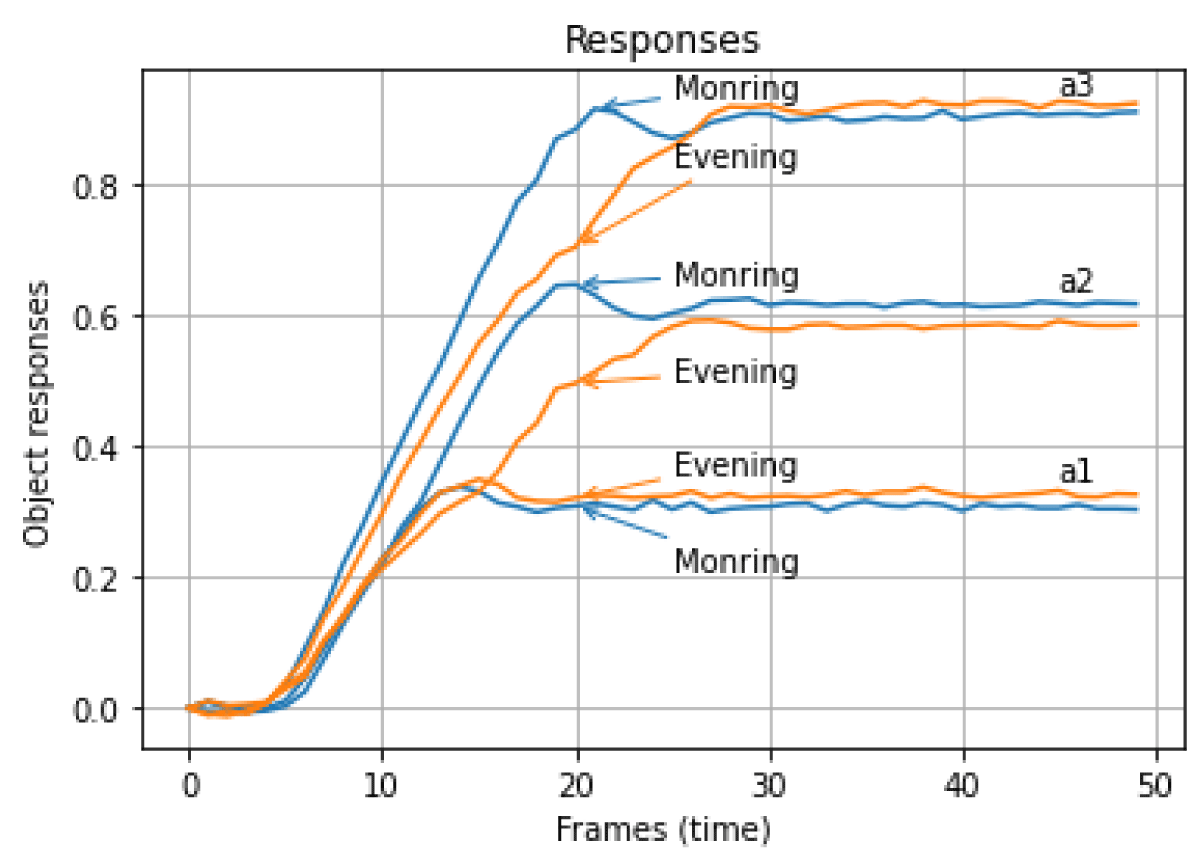
Figure 1: OMS responses at different amplitudes of test signals.
According to the OMS responses based on calculations using formulas (7) – (9), the transient functions of the OMS “In the Morning” and “In the Evening” were determined when using approximation models of various degrees of N (N = 1, 2, 3): with N = 1 – (8); with N = 2 – and (9); with N = 3 – , and (7).
The graphs of the transient functions of the OMS and the corresponding responses of the OMS based on the model at N = 1 (3) at different amplitudes of the input signals for the state of the respondent “In the morning” and “In the evening” are shown in Figures 2,3.
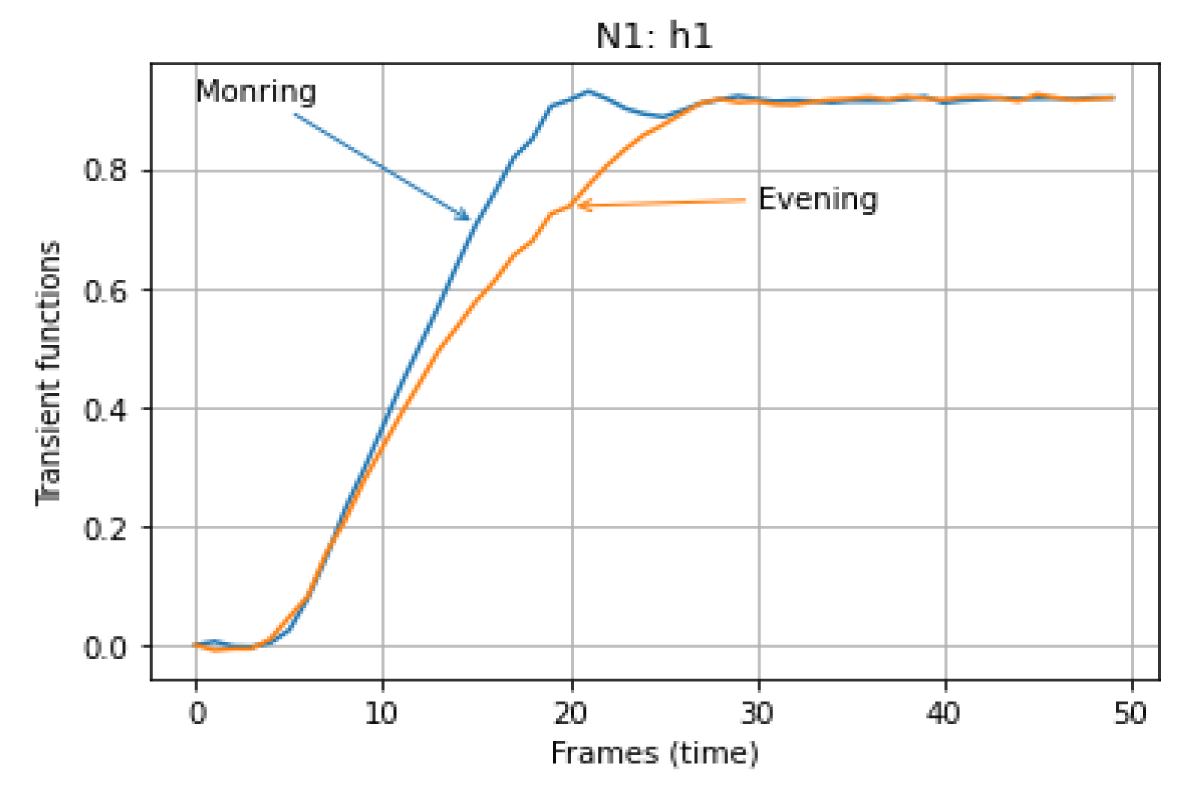
Figure 2: Transient functions of the OMS models at N=1 for the state of the respondent "In the Morning" and "In the Evening".
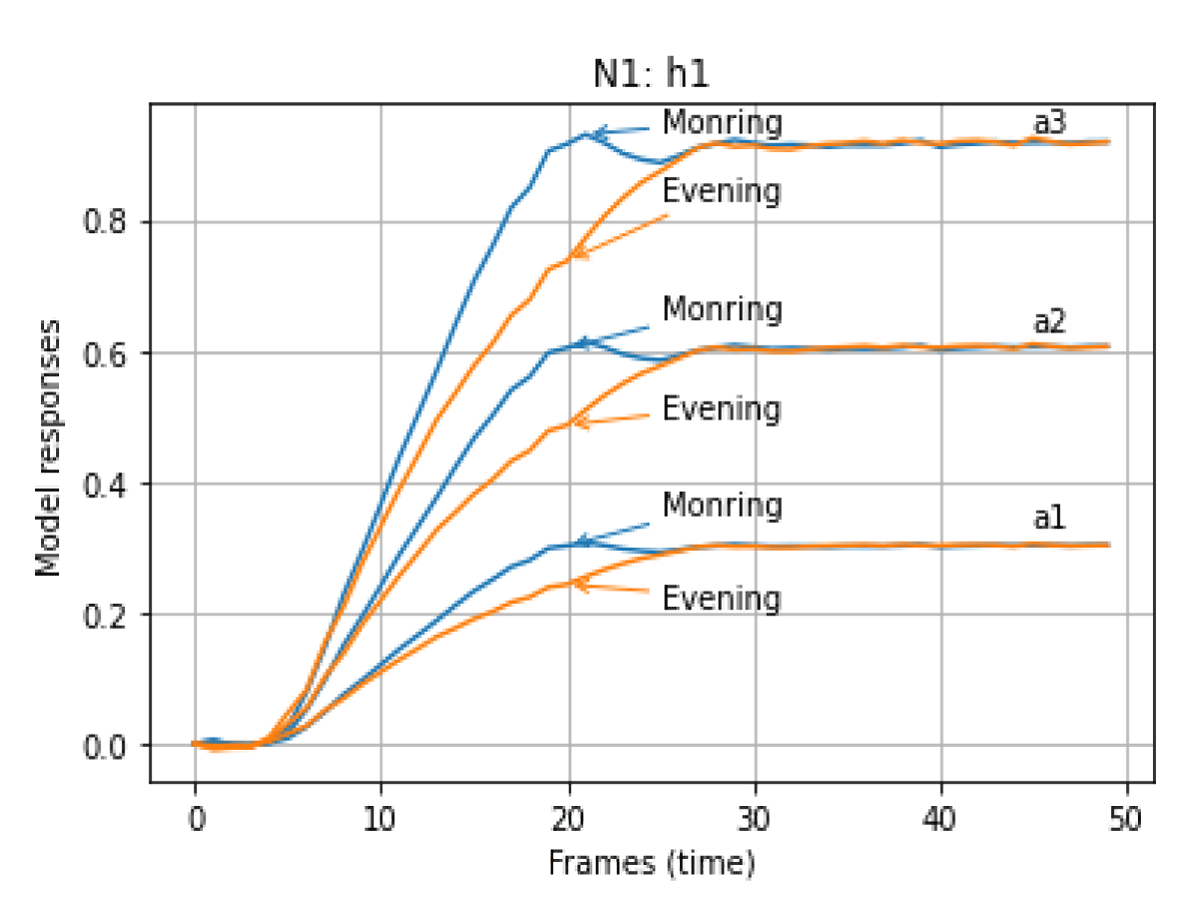
Figure 3: Responses of the OMS models at N = 1 for different amplitudes of test signals "In the Morning" and "In the Evening".
The normalized Root Mean Square Errors (RMSE) of the OMS model at N = 1 were calculated for different amplitudes of input signals a1, a2, and a3 for the states of the respondent “In the Morning” and “In the Evening”, which are given in Table 1. Similar results were obtained based on the model with N = 2 and are shown in Figures 4,5 – for the state of the respondent “In the Morning” and “In the Evening”, as well as based on the model with N = 3 and shown in Figures 6,7 – for the state of the respondent “In the Morning” and “In the Evening”. RMSE of the OMS model at N = 2 for different amplitudes of input signals a1, a2, and a3 for the states of the respondent “In the Morning” and “In the Evening”, which are given in Table 2. RMSE of the OMS model at N=3 for different amplitudes of input signals a1, a2, and a3 for the states of the respondent “In the Morning” and “In the Evening”, which are given in Table 3.
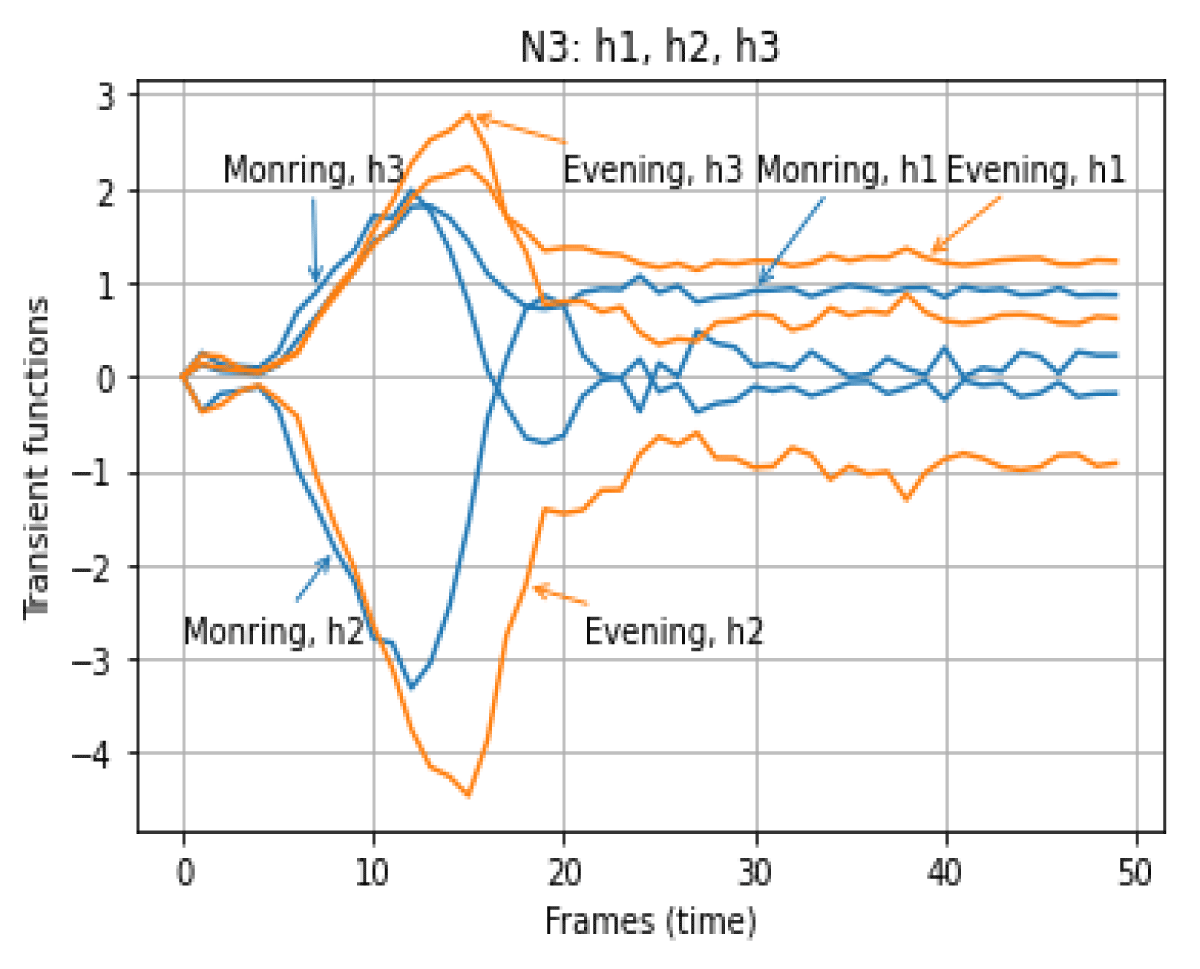
Figure 6: Transient functions of the OMS models at N = 3 for the state of the respondent "In the Morning" and "In the Evening".
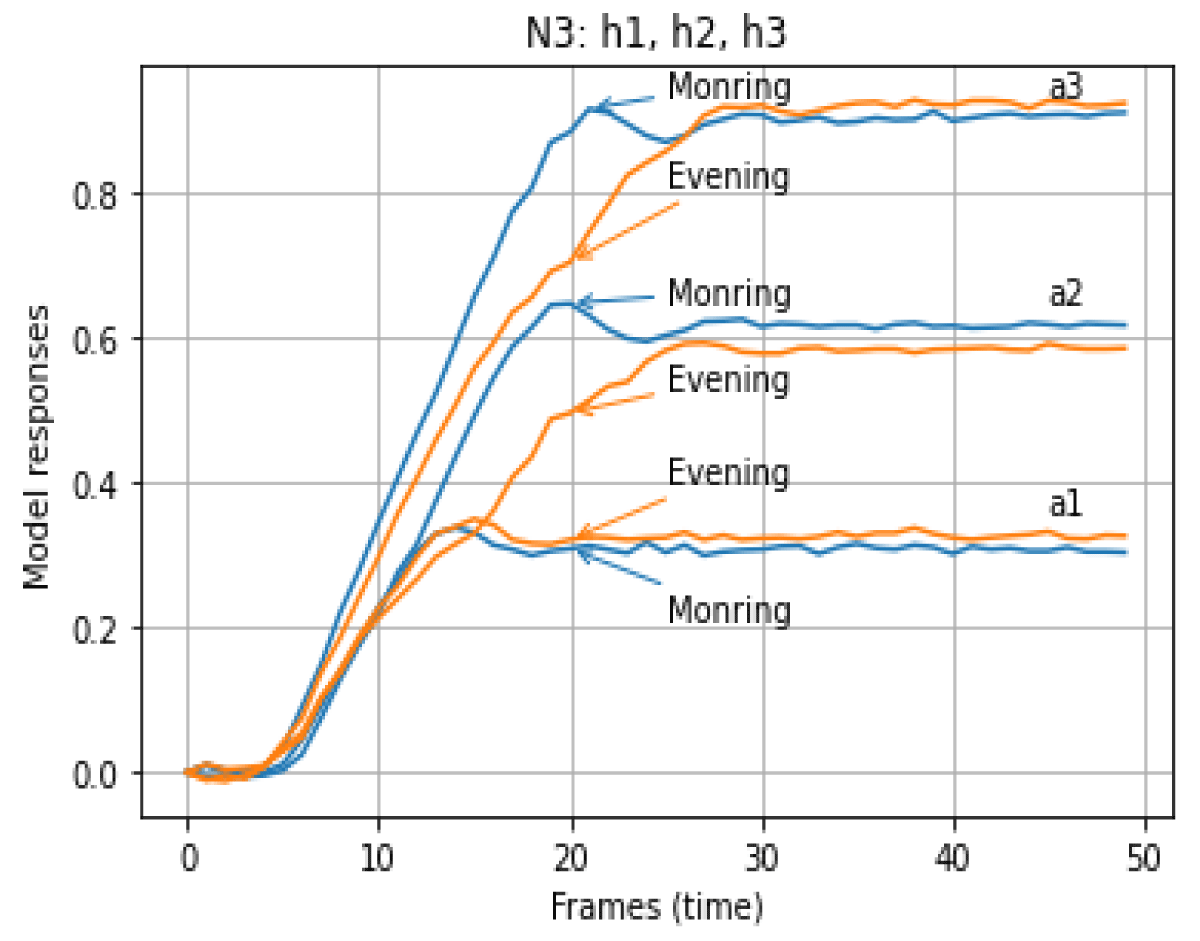
Figure 7: Responses of the OMS models at N = 3 for different amplitudes of test signals "In the Morning" and "In the Evening".
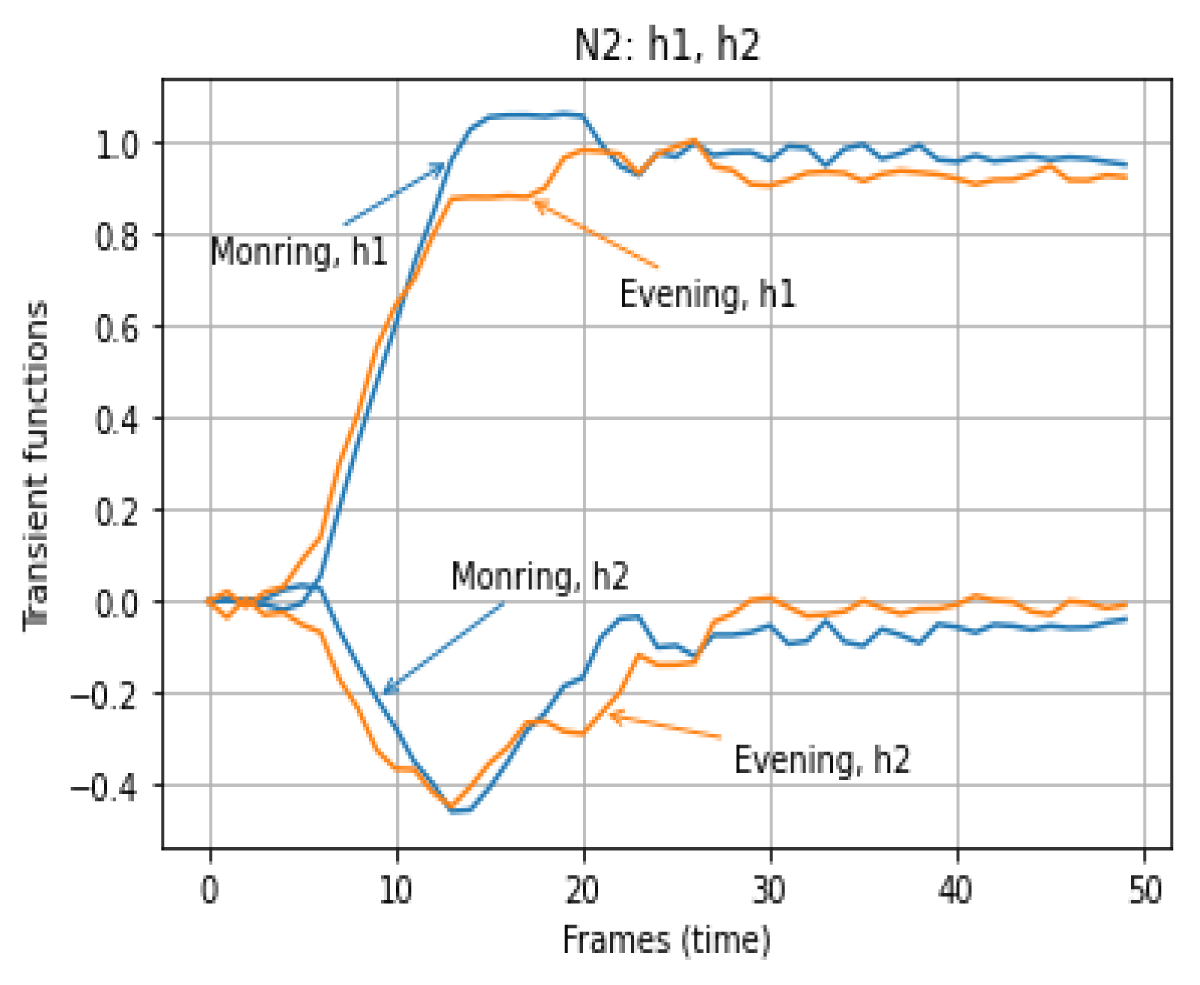
Figure 4: Transient functions of the OMS models at N = 2 for the state of the respondent "In the Morning" and "In the Evening".
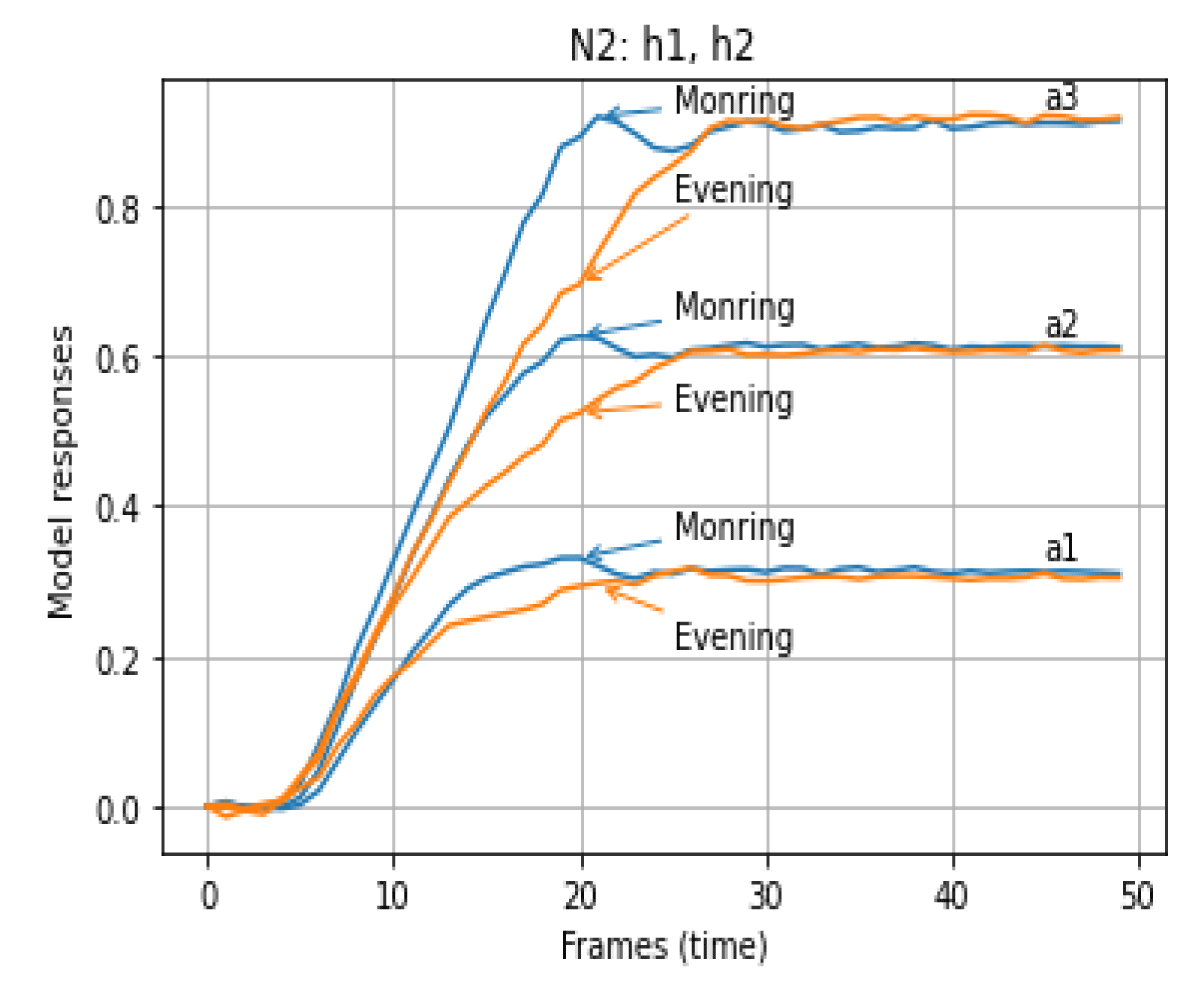
Figure 5: Responses of the OMS models at N = 2 for different amplitudes of test signals "In the Morning" and "In the Evening".
| Table 1: RMSE of the OMS model at N = 1. | |||
| The state of the respondent | Amplitudes of input signals | ||
| a1 | a2 | a3 | |
| "In the Morning" | 0.0468 | 0.0185 | 0.0193 |
| "In the Evening" | 0.0670 | 0.0215 | 0.0162 |
| Table 2: RMSE of the OMS model at N = 2. | |||
| The state of the respondent | Amplitudes of input signals | ||
| a1 | a2 | a3 | |
| "In the Morning" | 0.0230 | 0.0230 | 0.0077 |
| "In the Evening" | 0.0379 | 0.0379 | 0.0126 |
| Table 3: RMSE of the OMS model at N = 3. | |||
| The state of the respondent | Amplitudes of input signals | ||
| a1 | a2 | a3 | |
| "In the Morning" | 8.5055e-15 | 6.6127e-15 | 8.3227e-15 |
| "In the Evening" | 1.4341e-14 | 8.5165e-15 | 1.0437e-14 |
To assess the psychophysiological state of an individual based on the OMS model in the form of first-order t transient functions h1(m), and diagonal intersections of second and third order transient functions h2(m,m) and h3(m,m,m), training data samples were formed for the two states of the respondent using the proposed heuristic features determined on the basis of the obtained MTF. Training data samples are used to build classifiers of the psychophysiological states of an individual using machine learning tools [19,20]. A psychophysiological state classifier was built on the basis of the training set of data for objects of classes Ω1 (“In the Morning” – 8 complete research cycles) and Ω2 (“In the Evening” – 8 complete research cycles). To recognize objects of two classes (the case of dichotomy), the shifted discriminant function of the Bayesian species classifier is used [21,22]:
(12)
Where x = (x1,x2,…,xn)’ is a vector of features, n is the dimension of the space of features, mi is a vector of mathematical expectations of features of class i, i = 1, 2; Si = M[(x-mi)(x-mi)’] is the covariance matrix for class i (M [] is a mathematical expectation operation); is the matrix inverted to Si, |Si| is the determinant of the Si matrix, λmax is the object classification threshold, which ensures the maximum value of the criterion of the Probability of Correct Recognition (PCR).
The analysis of the reliability of the classification of psychophysiological states in the space of the proposed features consists of the formation of all possible combinations of features and the assessment of their informativeness, which is based on the results of the classification of the studied sample of data using the PCR criterion [20]. Thus, all possible pairs of features were investigated by the method of complete search.
Bayesian classifier of psychophysiological states in the two-dimensional space of features, which provides the maximum PCR Pmax = 0.938 for the following combinations of features, which are determined on the basis of the Volterra model at N = 3:
(13)
or
(14)
or
(15)
or
(16)
or
(17)
or
(18)
or
(19)
or
(20)
or
(21)
or
(22)
An analysis of the stability of the indicator of informativeness of different feature spaces was carried out. For this, random samples with a Gaussian probability density distribution were created, where the standard deviation of the distribution is equal to the product of the mean value of the feature vector at the noise level (1% and 5%). The results of the PCR stability analysis are presented in Figure 8, Table 4.
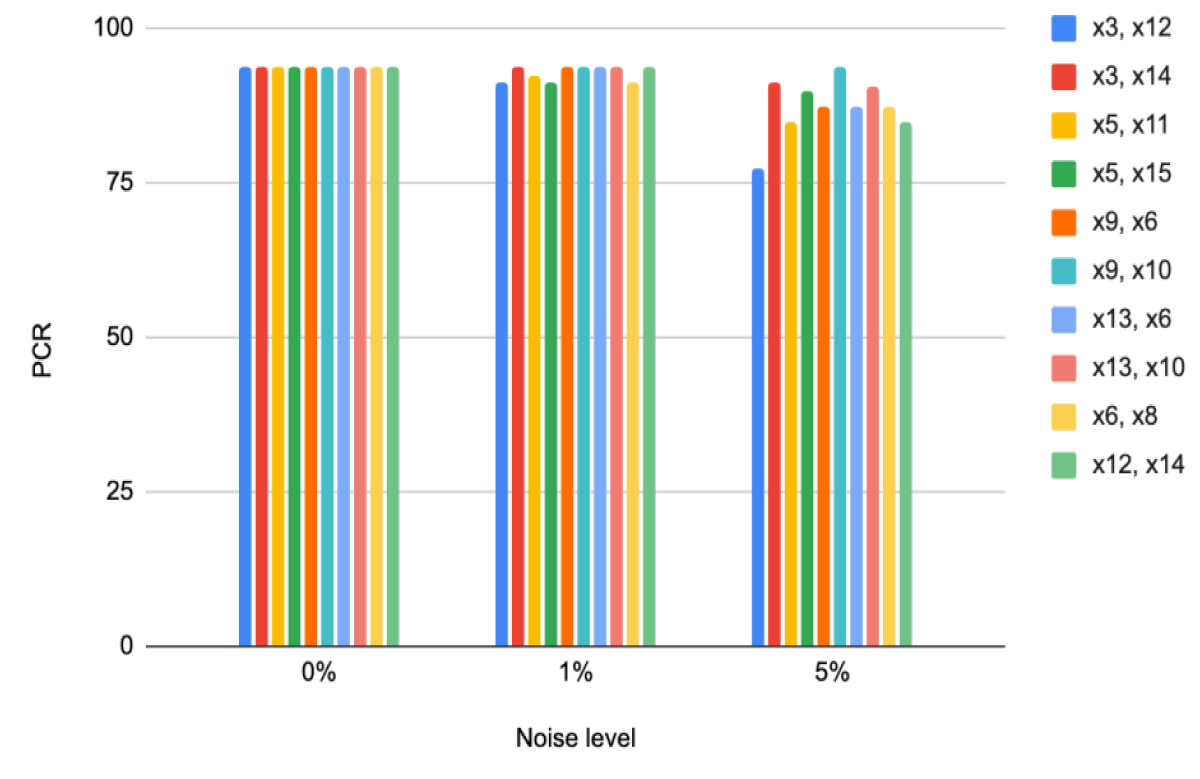
Figure 8: PCR for classifiers in the spaces of selected features when the features are affected by different levels of noise.
| Table 4: Average values of PCR (%) for classifiers in feature spaces with different levels of additive noise. | |||
| Feature combinations |
Noise level, % | ||
| 0 | 1 | 5 | |
| х3, х12 | 93.75 | 91.25 | 77.50 |
| x3, х14 | 93.75 | 93.75 | 91.25 |
| х5, х11 | 93.75 | 92.19 | 85.00 |
| х5, х15 | 93.75 | 91.25 | 90.00 |
| х9, х6 | 93.75 | 93.75 | 87.50 |
| х9, х10 | 93.75 | 93.75 | 93.75 |
| х13, х6 | 93.75 | 93.75 | 87.50 |
| х13, х10 | 93.75 | 93.75 | 90.63 |
| х6, х8 | 93.75 | 91.25 | 87.50 |
| х12, х14 | 93.75 | 93.75 | 85.00 |
Therefore, the most interference-resistant combinations of features according to the PCR Pmax indicator at a noise level of 1% are: (x3, x14), (x9, x6), (x13, x6), (x13, x10), (x12, x14) (highlighted in Table 1); at a noise level of 5% – (x9, x10). Figure 9 shows the location of objects of the training set in the feature space (x9, x10).
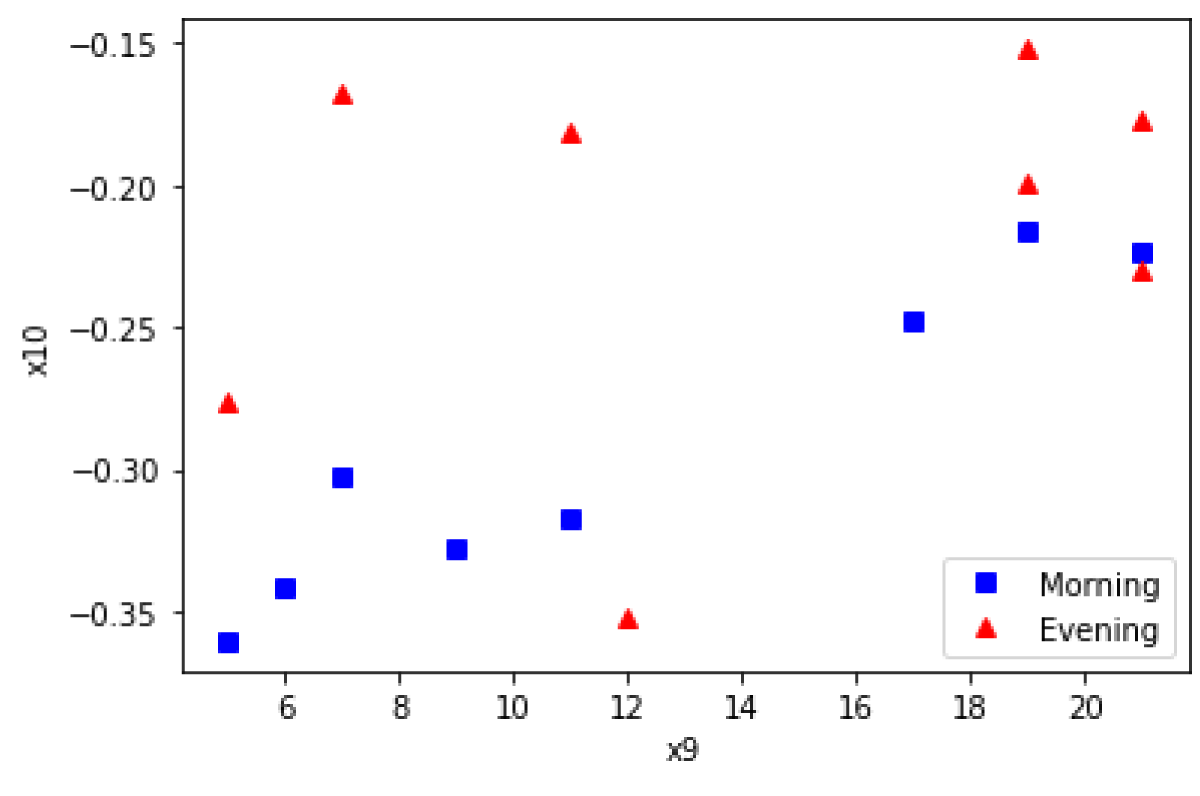
Figure 9: The location of objects of the training set in the feature space (x9, x10)
For individual signs, we have the following values of the PCR criterion: x9, x13 – Pmax = 0.625; x3 – Pmax = 0.688; x12 – Pmax = 0.75; x6, x10, x14 – Pmax = 0.813.
Support Vector Machine (SVM) was also used to build the classifier [21]. The best results of the evaluation of the efficiency of classifiers, built using SVM, were obtained in the feature spaces (x5,x15), (x9, x10), (x13, x10) and are shown in Table 2. In this case, SVM using a second-order kernel is used:
(23)
Where d is specified by parameter degree, d = 2. Calculation of indicators from Table 5 [19] was obtained using the Scikit-learn library (sklearn.svm.SVC class) and functions of the sklearn.metrics module.| Table 5: Metrics for evaluating the effectiveness of classifiers constructed in two-dimensional feature spaces using SVM. | |||
| Metrics | x5 & x15 | x9 & x10 | x13 & x10 |
| Error Type I, α | 1 | 2 | 2 |
| Error Type II, β | 1 | 1 | 1 |
| PCR , | 0.875 | 0.813 | 0.813 |
| Recall , | 0.875 | 0.875 | 0.875 |
| Precision , | 0.875 | 0.778 | 0.778 |
| F1- Score , | 0.875 | 0.824 | 0.824 |
The methodology of experimental studies of human OMS using innovative eye-tracking technology for registration of OMS responses to test visual stimuli was developed and implemented. The obtained empirical data of the “input-output” studies are used to identify the OMS based on Volterra polynomials. Experimental studies of the respondent’s OMS were carried out before and after the working day. Based on the data obtained with the Tobii Pro TX300 eye tracker, the transient functions of the first, second, and third orders of the OMS were determined. The variability of second-and third-order transient functions for different psychophysiological states of the respondent (by level of fatigue) was revealed. Thus, it seems appropriate to use multidimensional transient functions in diagnostic studies in the fields of neuroscience and psychology.
The information technology for diagnosing human psychophysiological states has received further development due to its use as a source of primary data for OMS information models based on Volterra polynomials. This allows for an increase in the accuracy of OMS modeling and, as a result, increases the reliability of diagnosis in the space of the proposed heuristic features.
A set of heuristic features is proposed, which are determined using integral and differential transformations of the MTF of the OMS. The informativeness of individual signs and all their possible combinations in pairs according to the PCR indicator was studied. Two-dimensional feature spaces with the maximum value of the PCR indicator were found when solving problems of assessing the psychophysiological state (fatigue state) of a person (Pmax = 0.938).
The authors are grateful to Prof. M. Milosz for the opportunity to conduct experimental research at the Laboratory of Motion Analysis and Interface Ergonomics of the Lublin University of Technology (Poland), as well as to Dr. M. Dzienkowski for help in using high-tech equipment – the eye-tracker Tobii Pro TX300.
- Corveleyn X, Justine B, Ott L, Lavenu I, Delayen C, Di Pastena A, Coello Y. Body-centred and Object-centred Motor Imagery in Alzheimer's Disease. Curr Alzheimer Res. 2018;15(3):247-258. doi: 10.2174/1567205014666171030105720. PMID: 29086694.
- El Haj M,Coello Y, Kapogiannis D, Gallouj K, Antoine P. "Antoine. Negative Prospective Memory in Alzheimer’s Disease: «Do Not Perform That Action»." Journal of Alzheimer's Disease. 2017; 61.2: 663-672.
- Rigas I, Komogortsev O, Shadmehr R. "Biometric Recognition via the Complex Eye Movement Behavior and the Incorporation of Saccadic Vigor and Acceleration Cues. " ACM Transactions on Applied Perception. 2016; 13.2: 1-21.
- Lanata A, Sebastiani L, Di Gruttola F, Di Modica S, Scilingo EP, Greco A. Nonlinear Analysis of Eye-Tracking Information for Motor Imagery Assessments. Front Neurosci. 2020 Jan 15; 13:1431. doi: 10.3389/fnins.2019.01431. PMID: 32009892; PMCID: PMC6974582.
- Jansson D, Medvedev A, Axelson H, Nyholm D. Stochastic Anomaly Detection in Eye-Tracking Data for Quantification of Motor Symptoms in Parkinson’s Disease, Signal and Image Analysis for Biomedical and Life Sciences, Springer International Publishing, Cham. 2014: 63-82.
- Jansson D, Rosen O, Medvedev A. "Parametric and Nonparametric Analysis of Eye-Tracking Data by Anomaly Detection. " IEEE Transactions on Control Systems Technology. 2015; 23.4: 2015:1578-1586.
- Bro V, Medvedev AV. "Nonlinear dynamics of the human smooth pursuit system in health and disease: Model structure and parameter estimation." IEEE 56th Annual Conference on Decision and Control (CDC). 2017; 4692-4697.
- Pavlenko V, Salata D, Dombrovskyi M, Maksymenko Yu. "Estimation of the Multidimensional Transient Functions Oculo-Motor System of Human." Mathematical Methods and Computational Techniques in Science and Engineering. 2017; 110-117.
- Pavlenko V, Salata D, Maksymenko Yu. "Nonlinear Dynamic Model of an Oculo-Motor System Human based on Volterra Kernels." WSEAS Transactions on Systems. 2017; 234-241.
- Pavlenko VD, Salata DV, Chaikovskyi HP. "Identification of an Oculo-Motor System Human Based on Volterra Kernels." International Journal of Biology and Biomedical Engineering. 2017;11: 121-126.
- Pavlenko V, Ivanov I, Kravchenko E. "Estimation of the Multidimensional Dynamical Characteristic Eye-Motor System." Proceedings of the 9th IEEE International Conference on Intelligent Data Acquisition and Advanced Computing Systems: Technology and Applications (IDAACS). 2017; 2: 645-650.
- Pavlenko VD, Fomin OO, Fedorova AN, Dombrovskyi MM. "Identification of Human Eye-Motor System Base on Volterra Model." Herald of the National Technical University "KhPI". A series of "Information and Modeling".2016; 21:1193; 74-85.
- Pavlenko V, Pavlenko S. "Deterministic Identification Methods for Nonlinear Dynamical Systems based on the Volterra Model." Applied Aspects оf Information Technology. 2018; 01.01: 9-29.
- Apartsyn AS, Solodusha SV, Spiryaev VA. "Modeling of Nonlinear Dynamic Systems with Volterra Polynomials." International Journal of Energy Optimization and Engineering. 2013; 2.4:16-43.
- Doyle FJ, Pearson RK, Ogunnaike BA. Identification and Control Using Volterra Models (Communications and Control Engineering), Springer London. 2001; 314.
- Pavlenko VD, Milosz M, Dzienkowski M. "Identification of the oculo-motor system based on the Volterra model using eye tracking technology." Journal of Physics: Conference Series. 2020; 1603: 012011.
- Tikhonov AN, Goncharsky AV, Stepanov VV, Yagola AG. Numerical Methods for the Solution of Ill-Posed Problems. Netherlands: Springer. 2013.
- Pavlenko V, Shamanina T, Chori V. "Nonlinear Dynamics Identification of the Oculo-Motor System based on Eye Tracking Data." International Journal of Circuits, Systems and Signal Processing. 2021; 15: 569-577.
- Tharwat A, Classification assessment methods, Applied Computing and Informatics. 2020; 1-13.
- Medvedew A, Fomin O, Pavlenko V, Speranskyy V. Diagnostic features space construction using Volterra kernels wavelet transforms, in: 9th IEEE International Conference on Intelligent Data Acquisition and Advanced Computing Systems: Technology and Applications (IDAACS), Bucharest, Romania. 2017; 2: 1077–1081. DOI: 10.1109/IDAACS.2017.8095251
- Vapnik VN. The Nature of Statistical Learning Theory. Springer Verlag New York Inc. 2010. Vapnik VN. "Complete Statistical Theory of Learning, Automation and Remote Control." 2019; 80:11; 1949-1975.