Figure 3
Pyridostigmine-Induced Status Epilepticus Rat Model Was Resistant to Increasing Doses of Ramipril: The Latter Triggered Epileptogenesis, Arrhythmia, and Cardiac Ischemia in a Dose-Dependent Manner
Sherine Abdelmissih*, Monica Gamal and Kerollos M Naeem
Published: 20 March, 2025 | Volume 9 - Issue 1 | Pages: 010-027
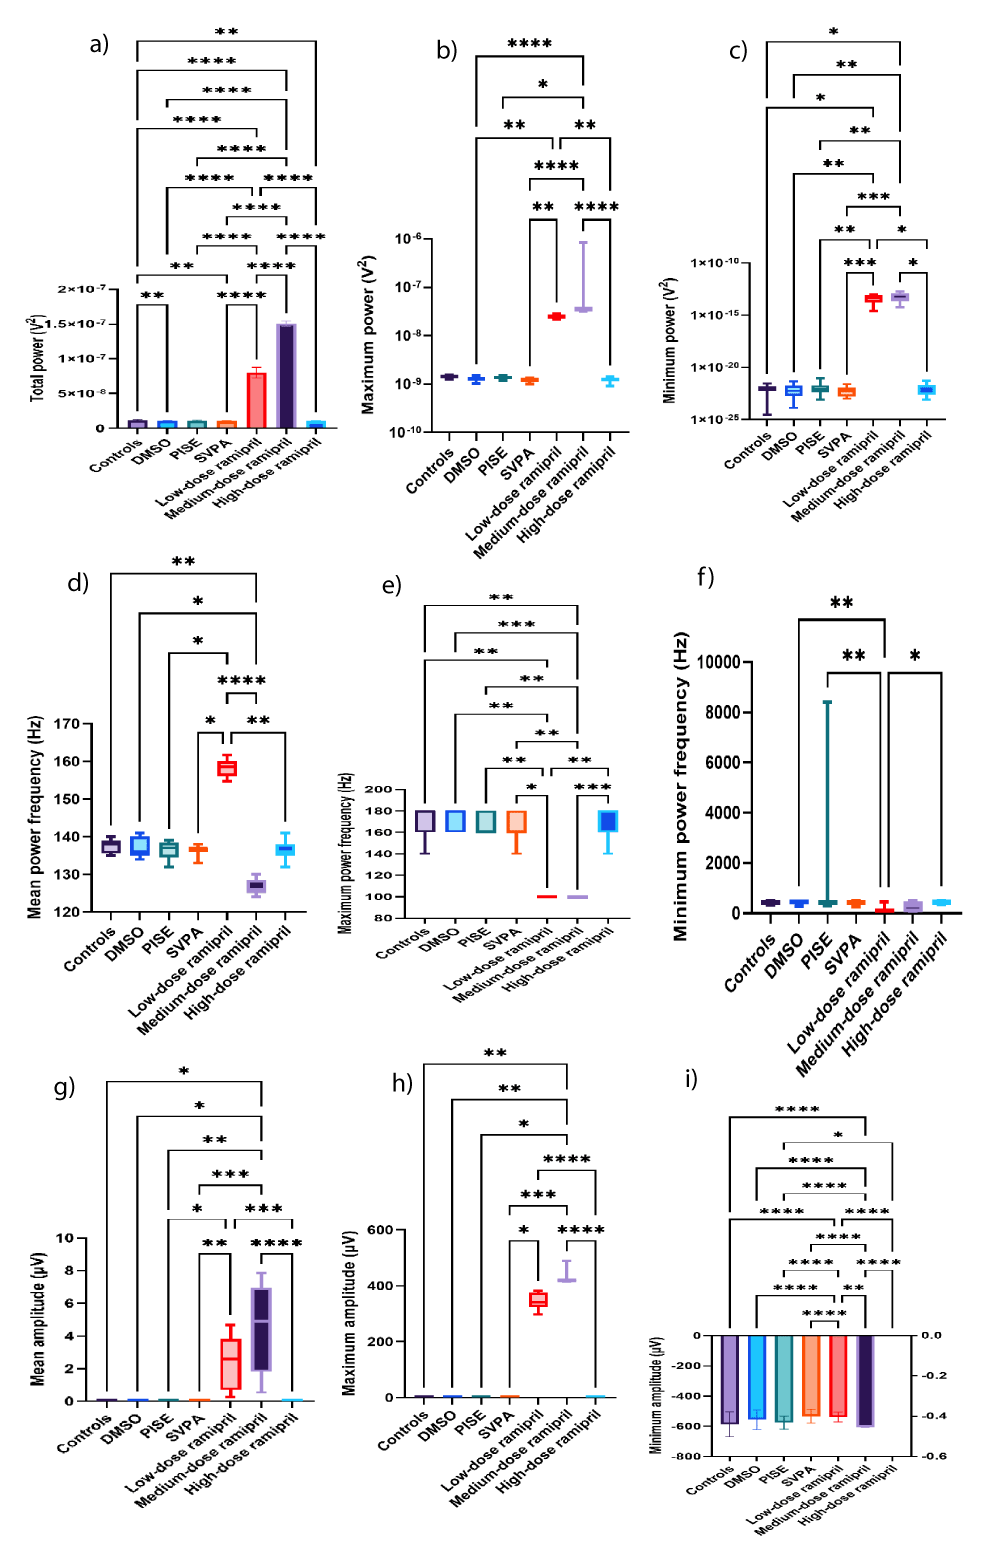
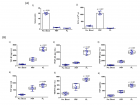
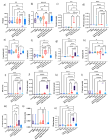
Figure 3:
Source EEG wave of adult male Wistar albino rats (N = 63). a. Total power (V2). Data are expressed as mean ± SD. b. Maximum power (V2). c. Minimum power (V2). d. Mean power frequency (Hz). e. Maximum power frequency (Hz). f. Minimum power frequency (Hz). g. Average amplitude (µV). h. Maximum amplitude (µV). Data are expressed as median and interquartile range. i. Minimum amplitude (µV). Data are expressed as mean ± SD. DMSO: dimethyl-sulfoxide; PISE: pyridostigmine-induced status epilepticus; SVPA: Sodium Valproate; BP: Blood Pressure. p ˂ 0.05 is considered statistically significant. * p ˂ 0.05, ** p ˂ 0.01, *** p ˂ 0.001, and **** p ˂ 0.0001.
Read Full Article HTML DOI: 10.29328/journal.jnnd.1001106 Cite this Article Read Full Article PDF
More Images
Similar Articles
-
Do genes matter in sleep?-A comprehensive updateRajib Dutta*. Do genes matter in sleep?-A comprehensive update. . 2020 doi: 10.29328/journal.jnnd.1001029; 4: 014-023
-
Impact of mandibular advancement device in quantitative electroencephalogram and sleep quality in mild to severe obstructive sleep apneaCuspineda-Bravo ER*,García- Menéndez M,Castro-Batista F,Barquín-García SM,Cadelo-Casado D,Rodríguez AJ,Sharkey KM. Impact of mandibular advancement device in quantitative electroencephalogram and sleep quality in mild to severe obstructive sleep apnea. . 2020 doi: 10.29328/journal.jnnd.1001041; 4: 088-098
-
Cerebral arterial air embolism with anterior spinal cord syndrome after CT-guided hook-wire localization of Lung mass and pulmonary noduleNoor Sameh Darwich*,Umran Ugur,Mark P Anstadt,J Pedoto. Cerebral arterial air embolism with anterior spinal cord syndrome after CT-guided hook-wire localization of Lung mass and pulmonary nodule. . 2021 doi: 10.29328/journal.jnnd.1001044; 5: 006-015
-
Cortical spreading depolarizations in the context of subarachnoid hemorrhage and the role of ketamineLeandro Custódio do Amaral*. Cortical spreading depolarizations in the context of subarachnoid hemorrhage and the role of ketamine. . 2021 doi: 10.29328/journal.jnnd.1001045; 5: 016-021
-
Update in the Understanding, Diagnosis, and Management of Sturge Weber Syndrome: Case ReportMariana Catalina Garcini Sandoval*, Enrique Espinosa Zúñiga, Martha Guadalupe García Toribio. Update in the Understanding, Diagnosis, and Management of Sturge Weber Syndrome: Case Report. . 2023 doi: 10.29328/journal.jnnd.1001080; 7: 061-064
-
The Potential Use of Dimethyltryptamine against Ischemia-reperfusion Injury of the BrainAttila Kovacs, Anna Mathe, Ede Frecska*. The Potential Use of Dimethyltryptamine against Ischemia-reperfusion Injury of the Brain. . 2024 doi: 10.29328/journal.jnnd.1001097; 8: 050-056
-
Pyridostigmine-Induced Status Epilepticus Rat Model Was Resistant to Increasing Doses of Ramipril: The Latter Triggered Epileptogenesis, Arrhythmia, and Cardiac Ischemia in a Dose-Dependent MannerSherine Abdelmissih*,Monica Gamal,Kerollos M Naeem. Pyridostigmine-Induced Status Epilepticus Rat Model Was Resistant to Increasing Doses of Ramipril: The Latter Triggered Epileptogenesis, Arrhythmia, and Cardiac Ischemia in a Dose-Dependent Manner. . 2025 doi: 10.29328/journal.jnnd.1001106; 9: 010-027
Recently Viewed
-
The Impact of Artificial Intelligence on the Daily Responsibilities of Family Doctors: A Comprehensive Review of Current KnowledgeAdawi Mohammad*,Awni Yousef. The Impact of Artificial Intelligence on the Daily Responsibilities of Family Doctors: A Comprehensive Review of Current Knowledge. J Community Med Health Solut. 2025: doi: 10.29328/journal.jcmhs.1001061; 6: 067-076
-
Remote Effect of Fascial Manipulation on Knee Pain: A Case ReportAsifuzzaman Shahriyar Ahmed*, Deepak Kumar Pradhan. Remote Effect of Fascial Manipulation on Knee Pain: A Case Report. J Nov Physiother Rehabil. 2024: doi: 10.29328/journal.jnpr.1001059; 8: 017-021
-
Analysis of Polymers and Organic GSR from 3D Printed Firearm using Direct Analysis in Real-time Mass Spectrometry (DART-MS)Oindrila Mahapatra*,Ishan Jain. Analysis of Polymers and Organic GSR from 3D Printed Firearm using Direct Analysis in Real-time Mass Spectrometry (DART-MS). J Forensic Sci Res. 2025: doi: 10.29328/journal.jfsr.1001098; 9: 173-178
-
Stature Estimation from Regression Analysis of Craniofacial Anthropometry in an Indian PopulationKamakshi Nayyar*,Pragnesh Parmar,Yadukul S,Prashanth M,Divya R. Stature Estimation from Regression Analysis of Craniofacial Anthropometry in an Indian Population. J Forensic Sci Res. 2025: doi: 10.29328/journal.jfsr.1001099; 9: 179-183
-
A Temporal Forecasting Framework for Palm Crease Analysis: A Phenomenological ApproachSandip Chandra*. A Temporal Forecasting Framework for Palm Crease Analysis: A Phenomenological Approach. J Forensic Sci Res. 2025: doi: 10.29328/journal.jfsr.1001100; 9: 184-187
Most Viewed
-
Feasibility study of magnetic sensing for detecting single-neuron action potentialsDenis Tonini,Kai Wu,Renata Saha,Jian-Ping Wang*. Feasibility study of magnetic sensing for detecting single-neuron action potentials. Ann Biomed Sci Eng. 2022 doi: 10.29328/journal.abse.1001018; 6: 019-029
-
Evaluation of In vitro and Ex vivo Models for Studying the Effectiveness of Vaginal Drug Systems in Controlling Microbe Infections: A Systematic ReviewMohammad Hossein Karami*, Majid Abdouss*, Mandana Karami. Evaluation of In vitro and Ex vivo Models for Studying the Effectiveness of Vaginal Drug Systems in Controlling Microbe Infections: A Systematic Review. Clin J Obstet Gynecol. 2023 doi: 10.29328/journal.cjog.1001151; 6: 201-215
-
Causal Link between Human Blood Metabolites and Asthma: An Investigation Using Mendelian RandomizationYong-Qing Zhu, Xiao-Yan Meng, Jing-Hua Yang*. Causal Link between Human Blood Metabolites and Asthma: An Investigation Using Mendelian Randomization. Arch Asthma Allergy Immunol. 2023 doi: 10.29328/journal.aaai.1001032; 7: 012-022
-
An algorithm to safely manage oral food challenge in an office-based setting for children with multiple food allergiesNathalie Cottel,Aïcha Dieme,Véronique Orcel,Yannick Chantran,Mélisande Bourgoin-Heck,Jocelyne Just. An algorithm to safely manage oral food challenge in an office-based setting for children with multiple food allergies. Arch Asthma Allergy Immunol. 2021 doi: 10.29328/journal.aaai.1001027; 5: 030-037
-
Postpartum as the best time for physical recovery and health careShizuka Torashima*,Mina Samukawa,Kazumi Tsujino,Yumi Sawada. Postpartum as the best time for physical recovery and health care. J Nov Physiother Rehabil. 2023 doi: 10.29328/journal.jnpr.1001049; 7: 001-007

If you are already a member of our network and need to keep track of any developments regarding a question you have already submitted, click "take me to my Query."


